Fig. 8
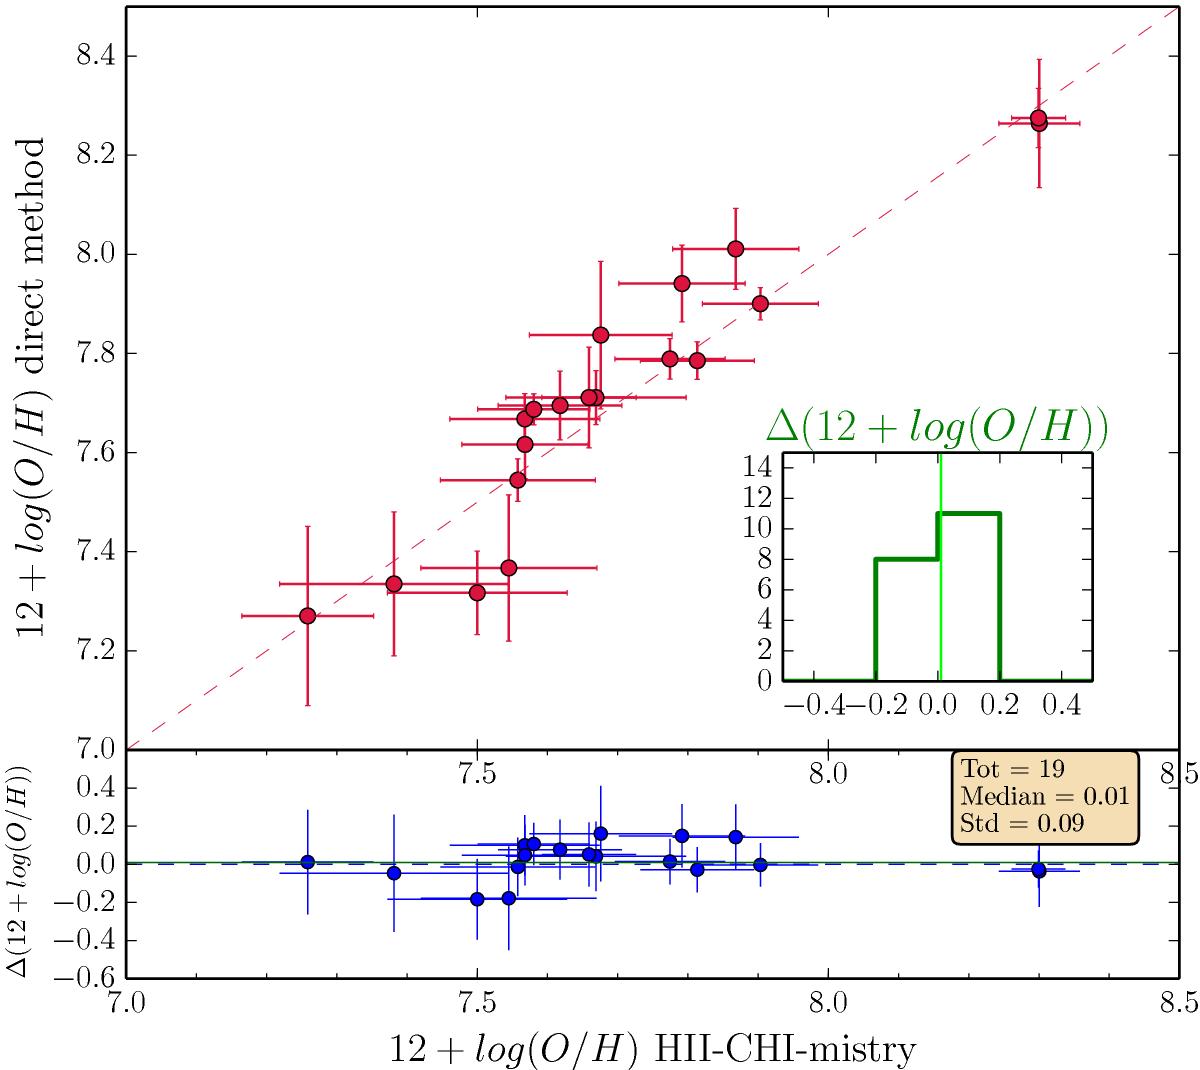
Comparison between the metallicity derived with the code HCm and the direct method, showing the consistency of our approach. The red dashed line is the 1:1 relation. At the bottom of the figure, the differences between the two methods are plotted as a function of the metallicity. The blue dashed line corresponds to the 0 level, while the blue continuous line is the median value. In the lower-right box, we have added the histogram with the distribution of the differences, with the median value line in green.
Current usage metrics show cumulative count of Article Views (full-text article views including HTML views, PDF and ePub downloads, according to the available data) and Abstracts Views on Vision4Press platform.
Data correspond to usage on the plateform after 2015. The current usage metrics is available 48-96 hours after online publication and is updated daily on week days.
Initial download of the metrics may take a while.