Fig. 4
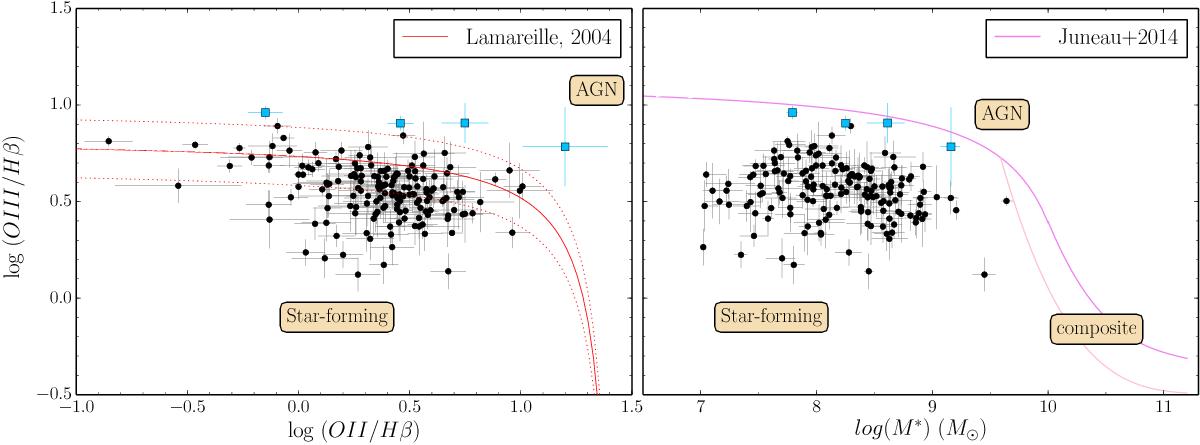
Left: diagnostic diagram to separate SFG, AGN and composite, comparing [O ii]λ3727/Hβ and [O iii]λ5007/Hβ. The starburst region is in the bottom-left part, while AGNs lie in upper-right part. The red line is the empirical separation by Lamareille et al. (2004) with 0.15 dex uncertainty. Right: MEx diagnostic diagram for our sample of emission-line galaxies. The diagram compares the excitation, that is, the emission line ratio [O iii]λ5007/Hβ, and the stellar mass M∗. The violet curve is the empirical separation limit between starburst, AGN, and composite regions according to Juneau et al. (2014). In both diagrams, we mark, with blue squares, the four galaxies that lie completely (also including the errors) in the AGN region according to Lamareille et al. (2004).
Current usage metrics show cumulative count of Article Views (full-text article views including HTML views, PDF and ePub downloads, according to the available data) and Abstracts Views on Vision4Press platform.
Data correspond to usage on the plateform after 2015. The current usage metrics is available 48-96 hours after online publication and is updated daily on week days.
Initial download of the metrics may take a while.