Fig. 3
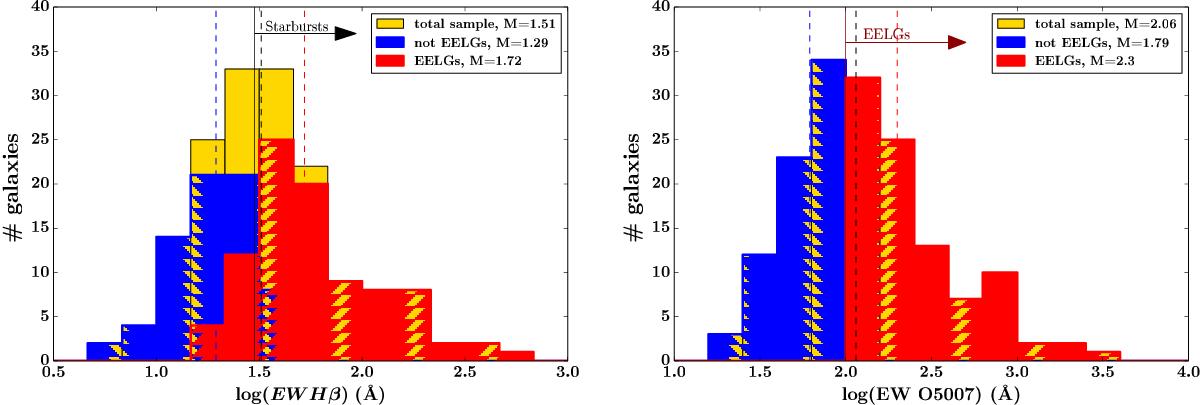
Distribution of EW(Hβ) and EW(O iii) for our sample of galaxies selected in Sect. 3.1. We lined the histogram with different colors; red for the EELG fraction (EW(O iii) >100 Å based on Amorín et al. 2015) and blue for the non-EELG subset. We emphasize, with vertical continuous lines, the empirical limits for starburst galaxies (EW(Hβ) >30 Å based on Terlevich et al. (1991) and EELGs, as well as, with vertical dashed lines, the median distribution for the whole sample (black), and the EELGs (red) and non-EELGs (blue) (the values are given in the legend). The standard deviations of the entire distribution are 0.37 and 0.42 for EW(Hβ) and EW(O iii), respectively.
Current usage metrics show cumulative count of Article Views (full-text article views including HTML views, PDF and ePub downloads, according to the available data) and Abstracts Views on Vision4Press platform.
Data correspond to usage on the plateform after 2015. The current usage metrics is available 48-96 hours after online publication and is updated daily on week days.
Initial download of the metrics may take a while.