Fig. 18
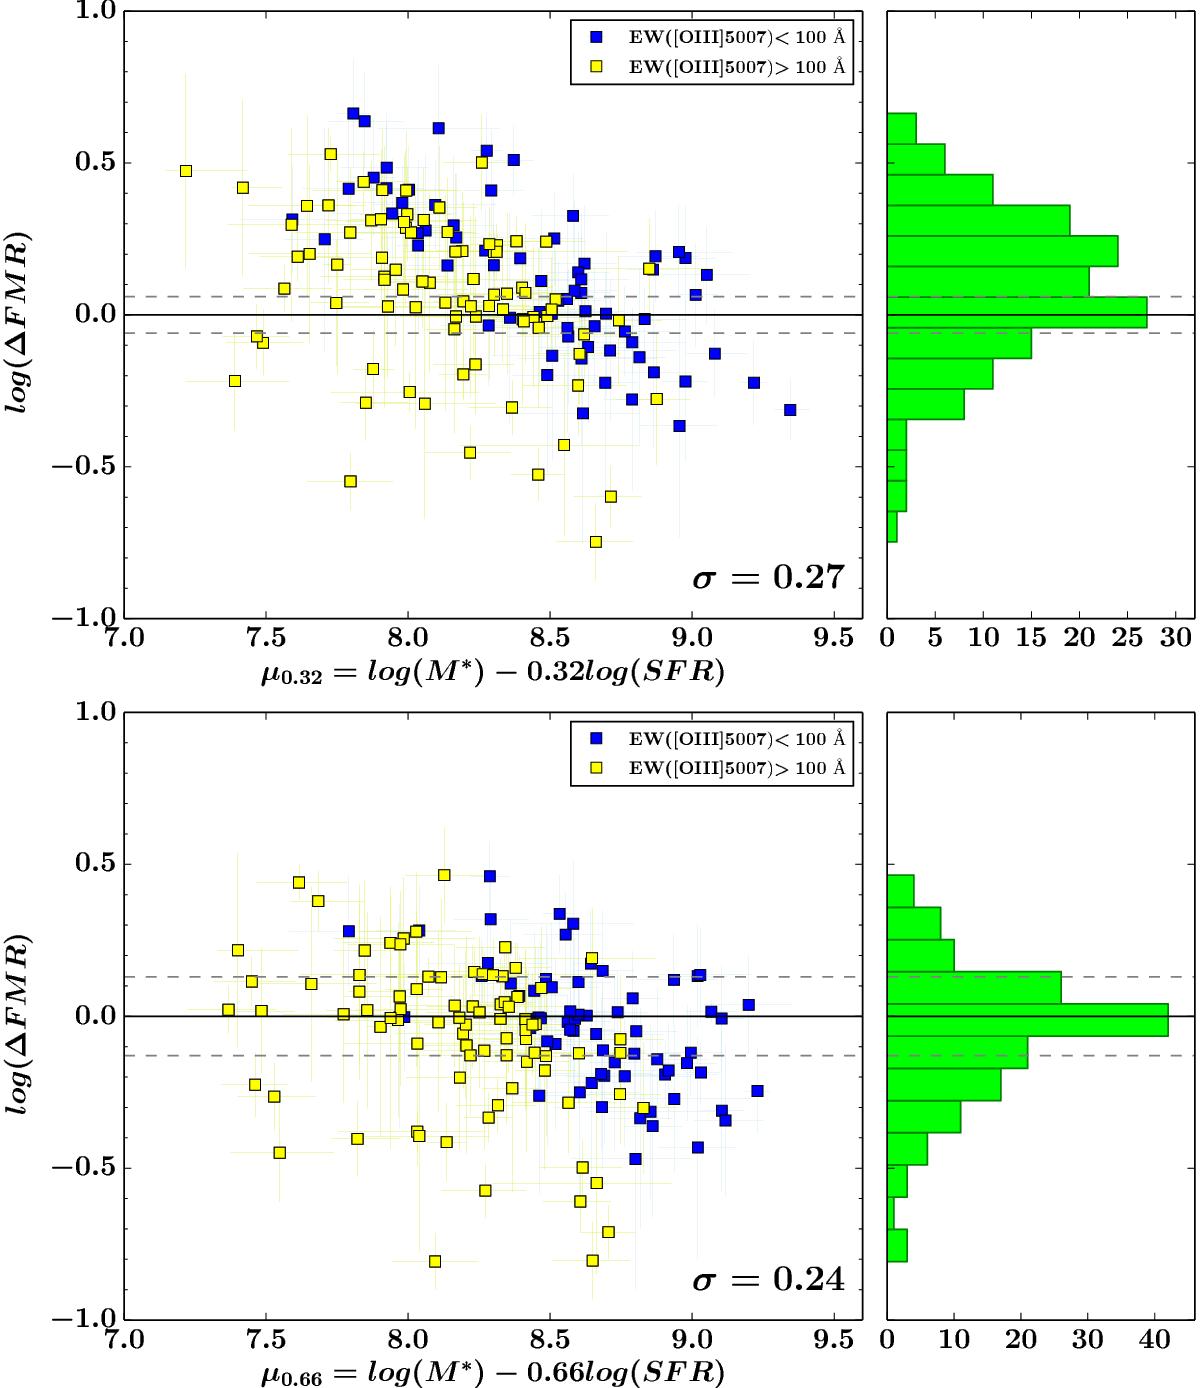
Diagrams showing the differences between the HCm metallicities and the FMR of Mannucci et al. (2011) (upper panel) and Andrews & Martini (2013) (bottom panel). The dashed lines represent 1σ deviations for these relations. The EELGs in our sample (EW([O iii]5007) >100 Å) show slightly larger scatter in the FMR than the whole population, in agreement with Amorín et al. (2014).
Current usage metrics show cumulative count of Article Views (full-text article views including HTML views, PDF and ePub downloads, according to the available data) and Abstracts Views on Vision4Press platform.
Data correspond to usage on the plateform after 2015. The current usage metrics is available 48-96 hours after online publication and is updated daily on week days.
Initial download of the metrics may take a while.