Free Access
Fig. 17
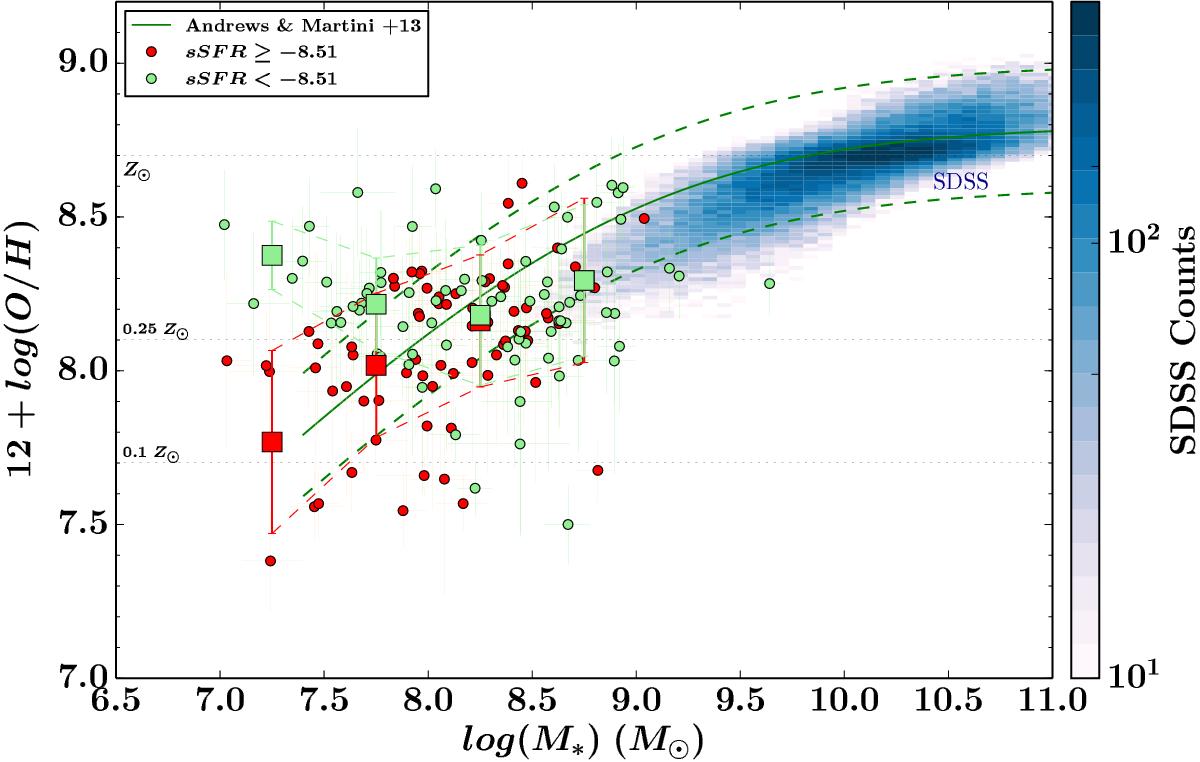
Mass-metallicity diagram for our galaxies, coded by the sSFR. We see that more metal-poor galaxies have, on average, higher sSFRs compared to those with higher oxygen abundances, and they follow different trends. The green dashed lines are ± 1σ uncertainty of AM13 MZR as in Fig. 15.
Current usage metrics show cumulative count of Article Views (full-text article views including HTML views, PDF and ePub downloads, according to the available data) and Abstracts Views on Vision4Press platform.
Data correspond to usage on the plateform after 2015. The current usage metrics is available 48-96 hours after online publication and is updated daily on week days.
Initial download of the metrics may take a while.