Fig. 16
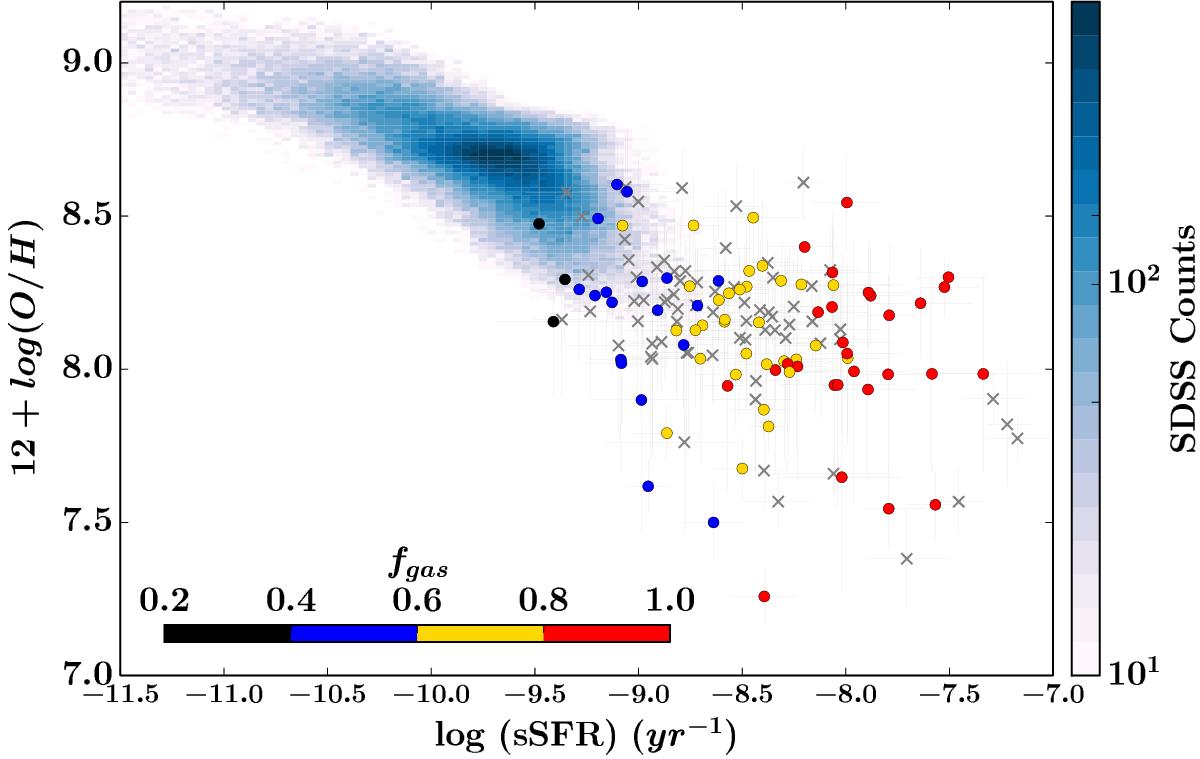
Diagram of metallicity vs. sSFR for VUDS SFDGs. Different colors represent galaxies with different gas fractions, divided into four bins in fgas: 0.2–0.4, 0.4–0.6, 0.6–0.8, and 0.8–1. Higher SSFRs also indicate higher gas fractions. Our sample extends the trend of local star-forming galaxies (the blue histogram) toward lower metallicities, showing that the SSFR is anti-correlated with the oxygen abundance, though the dispersion increases at higher sSFR. The overall scatter of the relation is ~0.5 dex in sSFR.
Current usage metrics show cumulative count of Article Views (full-text article views including HTML views, PDF and ePub downloads, according to the available data) and Abstracts Views on Vision4Press platform.
Data correspond to usage on the plateform after 2015. The current usage metrics is available 48-96 hours after online publication and is updated daily on week days.
Initial download of the metrics may take a while.