Fig. 15
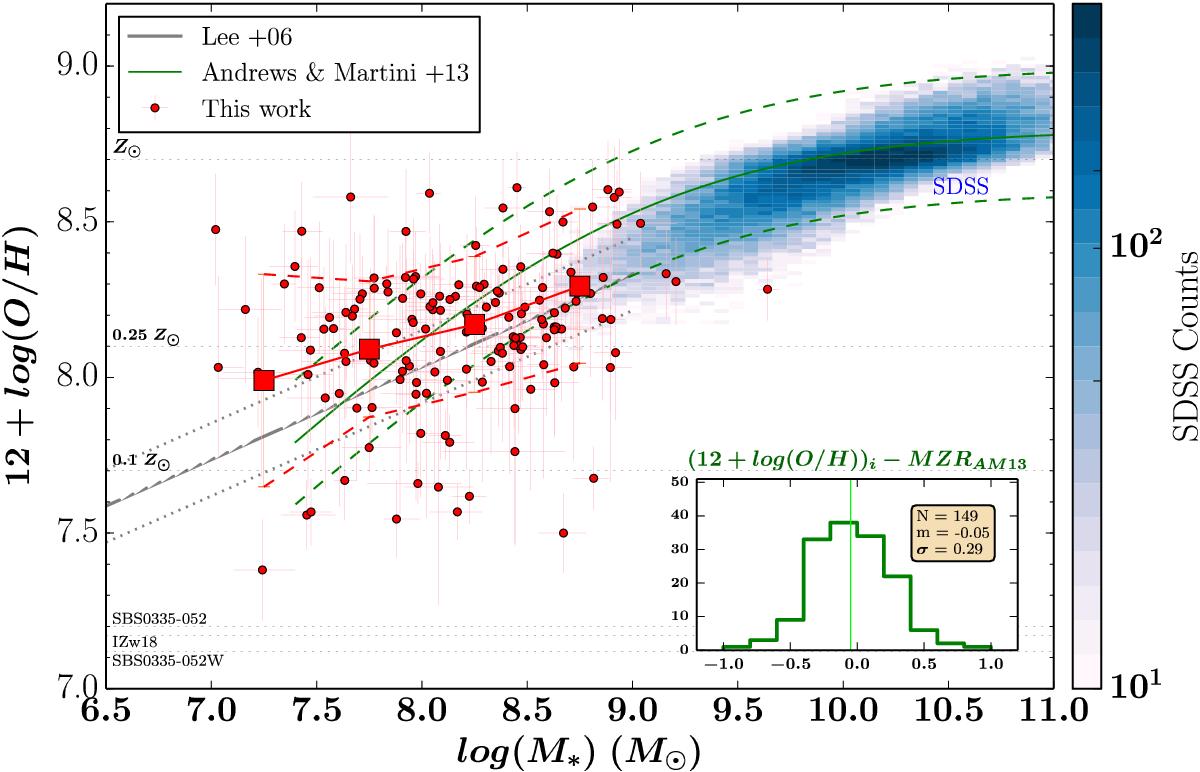
Mass-metallicity diagram for our sample of galaxies, compared to the MZR of Andrews & Martini (2013) and Lee et al. (2006). The green dashed lines and grey dotted lines represent, respectively, the ± 1σ uncertainty of AM13 MZR (≃ 0.2 dex) and the dispersion of L06 MZR (≃ 0.1 dex). The horizontal dashed lines represent constant metallicities, referred to the Sun, and the levels of the three most metal poor galaxies known in the local Universe. We show in this figure also our error-weighted mean metallicities (red squares) and 1σ standard deviations calculated in four bins of mass (log(M⊙) = [7–7.5, 7.5–8, 8–8.5, 8.5–9.5]). The histogram in the inset shows the differences between the metallicities derived with HCm and those obtained from AM13 MZR at given stellar mass. Our sample is on average slightly below the AM13 relation (median difference of 0.05 dex), with a 1σ scatter around the median difference of 0.29 dex. We report here the mean and the 1σ-std for each of the four mass bins of our MZR, in increasing order of mass: (m = 7.99, 1σ = 0.34), (m = 8.06, 1σ = 0.22), (m = 8.16, 1σ = 0.22), (m = 8.29, 1σ = 0.24). The SDSS galaxy sample is shown with a blue 2D histogram.
Current usage metrics show cumulative count of Article Views (full-text article views including HTML views, PDF and ePub downloads, according to the available data) and Abstracts Views on Vision4Press platform.
Data correspond to usage on the plateform after 2015. The current usage metrics is available 48-96 hours after online publication and is updated daily on week days.
Initial download of the metrics may take a while.