Fig. 14
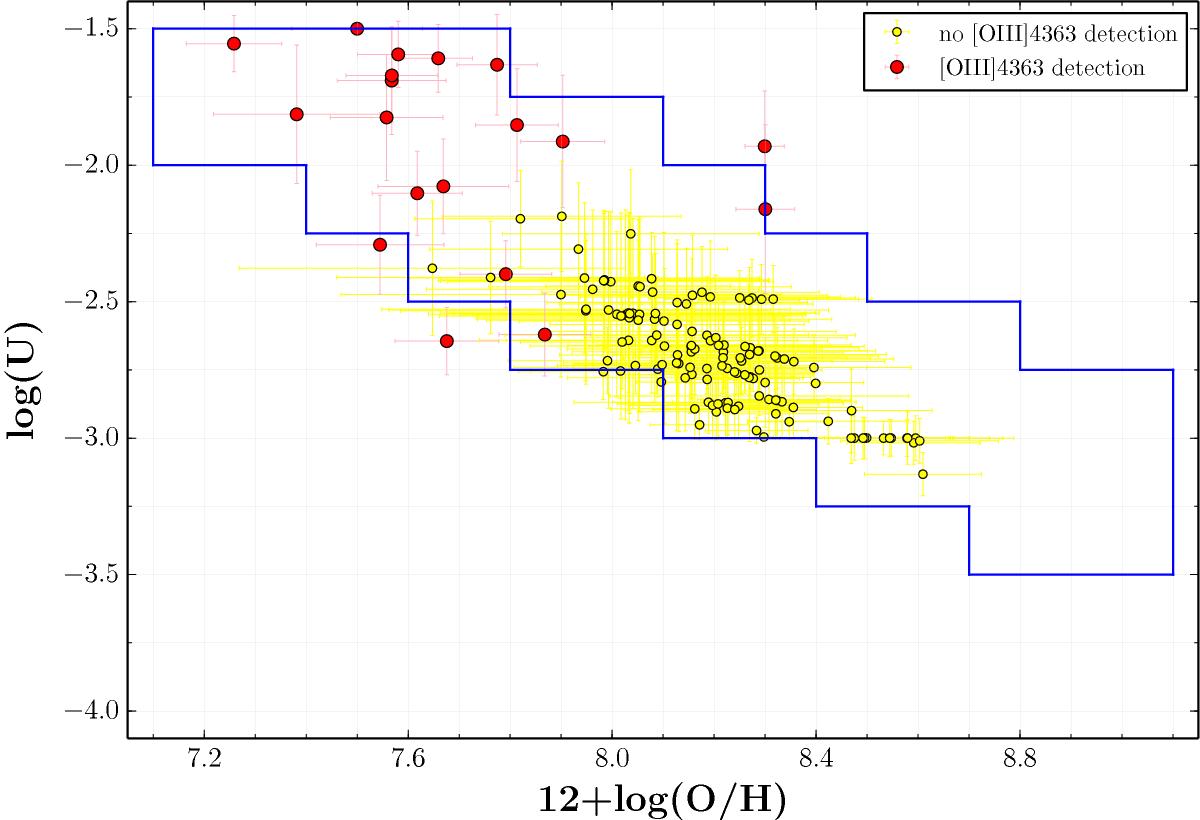
Comparison between the metallicity 12 +log (O/H) and log(U), both derived with the code HCm. The plot shows the anti-correlation between the two quantities, with the limited grid of models (green continuous line) considered by HCm when only [O iii]3727 Å and [O iii]5007 Å are available. Red points are the galaxies in our sample [O iii]4363 detection, showing that the empirical relation is real, since HCm does not introduce any assumptions in this case.
Current usage metrics show cumulative count of Article Views (full-text article views including HTML views, PDF and ePub downloads, according to the available data) and Abstracts Views on Vision4Press platform.
Data correspond to usage on the plateform after 2015. The current usage metrics is available 48-96 hours after online publication and is updated daily on week days.
Initial download of the metrics may take a while.