Free Access
Fig. 12
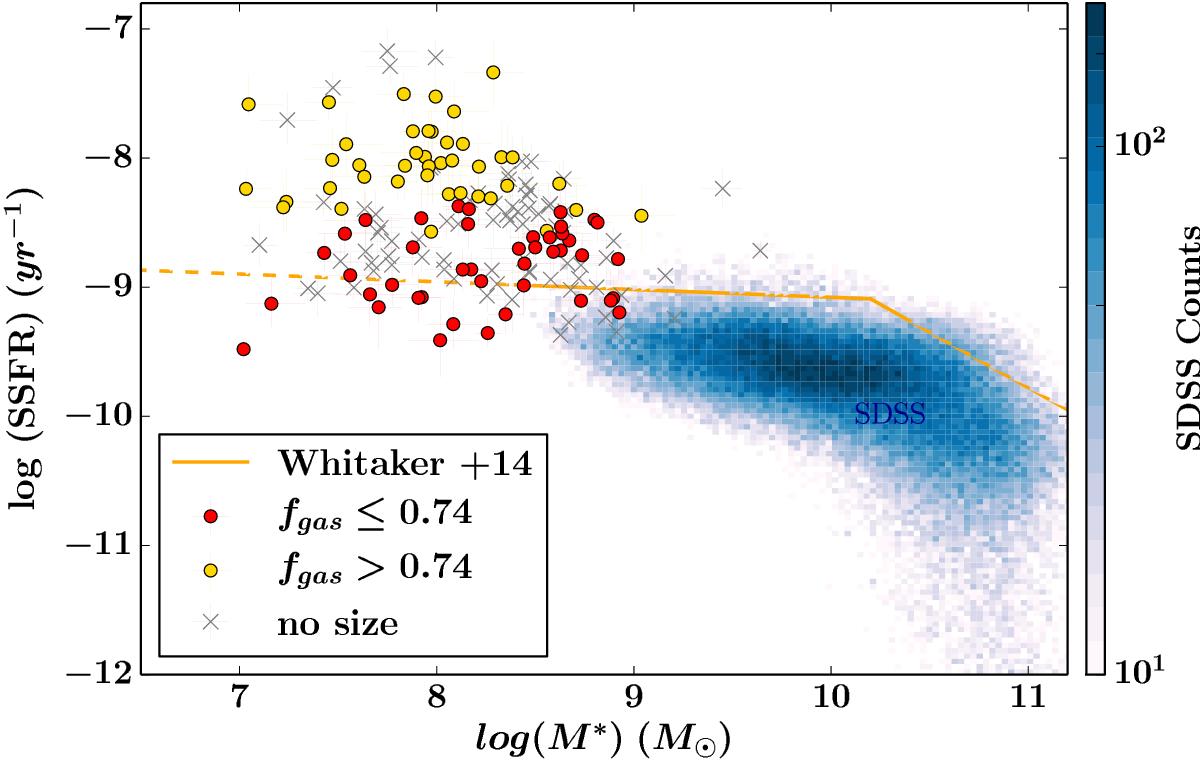
Diagram of sSFR vs. M∗ for our galaxies, coded by fgas (below). The segregation is evident between galaxies with higher and lower gas fraction than the median fgas,med = 0.74. The EELG fraction is evidenced with yellow colored circles.
Current usage metrics show cumulative count of Article Views (full-text article views including HTML views, PDF and ePub downloads, according to the available data) and Abstracts Views on Vision4Press platform.
Data correspond to usage on the plateform after 2015. The current usage metrics is available 48-96 hours after online publication and is updated daily on week days.
Initial download of the metrics may take a while.