Fig. 11
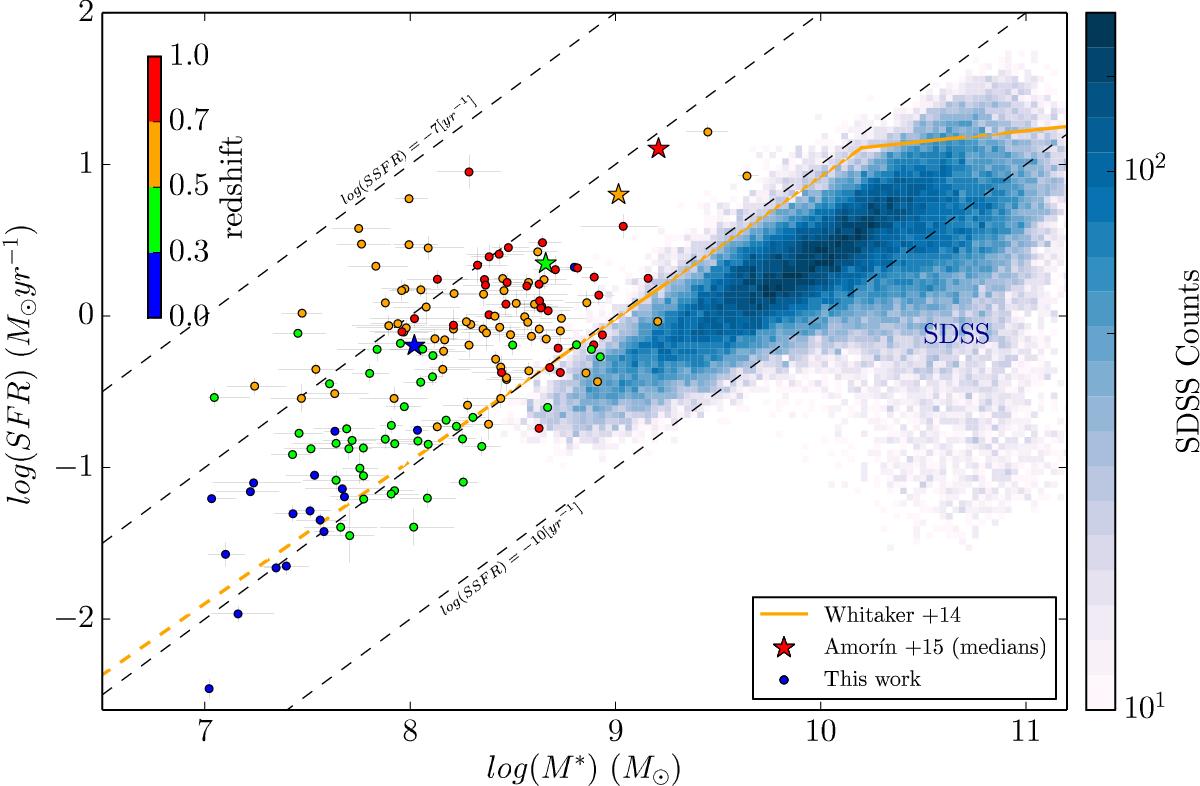
Diagram of SFR vs. M∗ for our sample. The galaxies are coded with different colors according to four redshift bins, and the colored stars represent the medians for zCOSMOS galaxies (Amorín et al. 2015) in four bins of masses. The orange continuous line represents the star-forming galaxies at similar redshift 0.5 < z < 1 (the so-called “Main Sequence of Star Formation”) derived by Whitaker et al. (2014). We extrapolate this line to the low-mass end of the diagram (dashed line). The dashed gray lines correspond to constant SSFR values, going from 10-10 yr-1 to 10-7 yr-1. We show our SDSS sample described in Sect. 2.3 using a blue 2D histogram.
Current usage metrics show cumulative count of Article Views (full-text article views including HTML views, PDF and ePub downloads, according to the available data) and Abstracts Views on Vision4Press platform.
Data correspond to usage on the plateform after 2015. The current usage metrics is available 48-96 hours after online publication and is updated daily on week days.
Initial download of the metrics may take a while.