Fig. 7
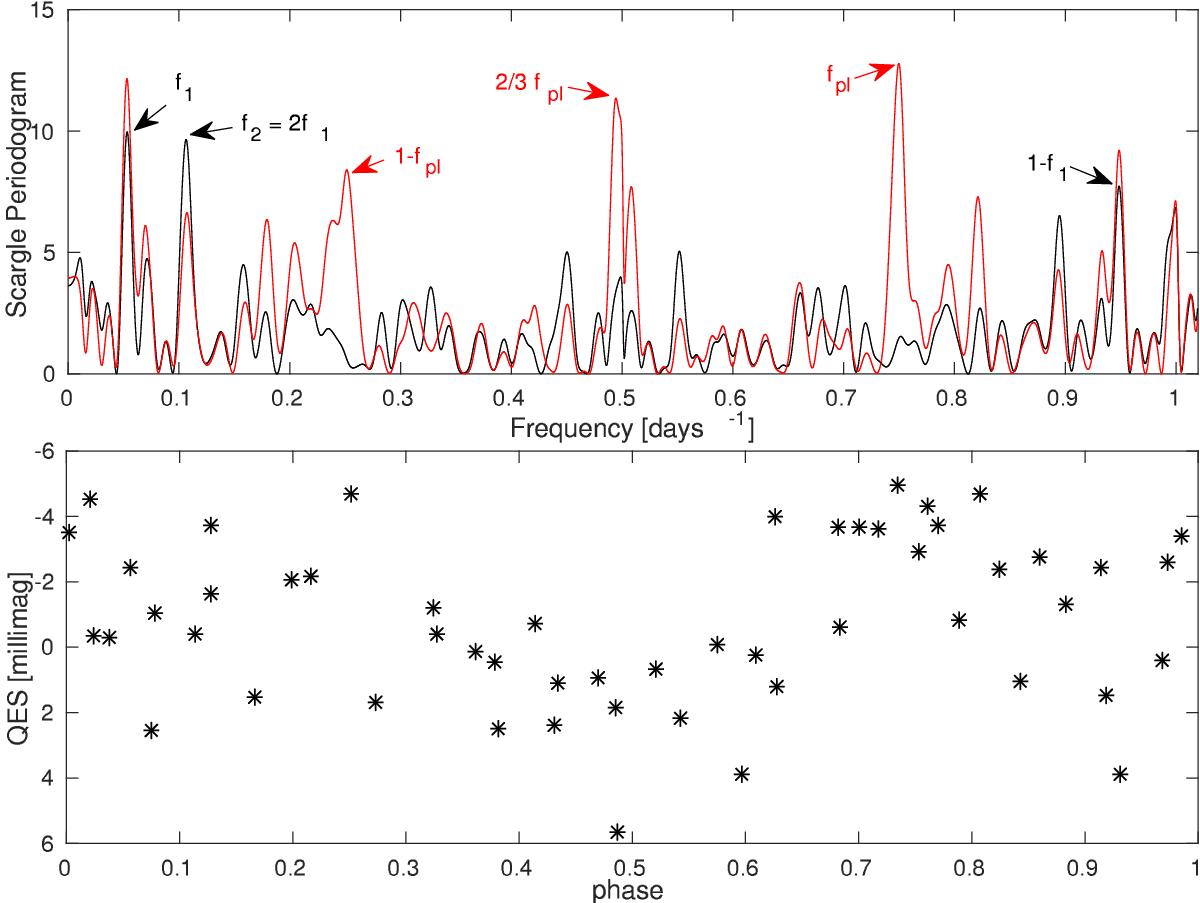
Top panel: Scargle periodogram of the QES photometric monitoring data of Qatar-2, before (red line) and after (black line) removing the in-transit points. fpl corresponds to the planet orbital period; we deem the peak at f1 to originate from a photometric modulation at the stellar rotational period. Bottom panel: nightly averaged photometric data phase-folded at the P1 ≡ 1 /f1=18.77 days period.
Current usage metrics show cumulative count of Article Views (full-text article views including HTML views, PDF and ePub downloads, according to the available data) and Abstracts Views on Vision4Press platform.
Data correspond to usage on the plateform after 2015. The current usage metrics is available 48-96 hours after online publication and is updated daily on week days.
Initial download of the metrics may take a while.