Fig. 15
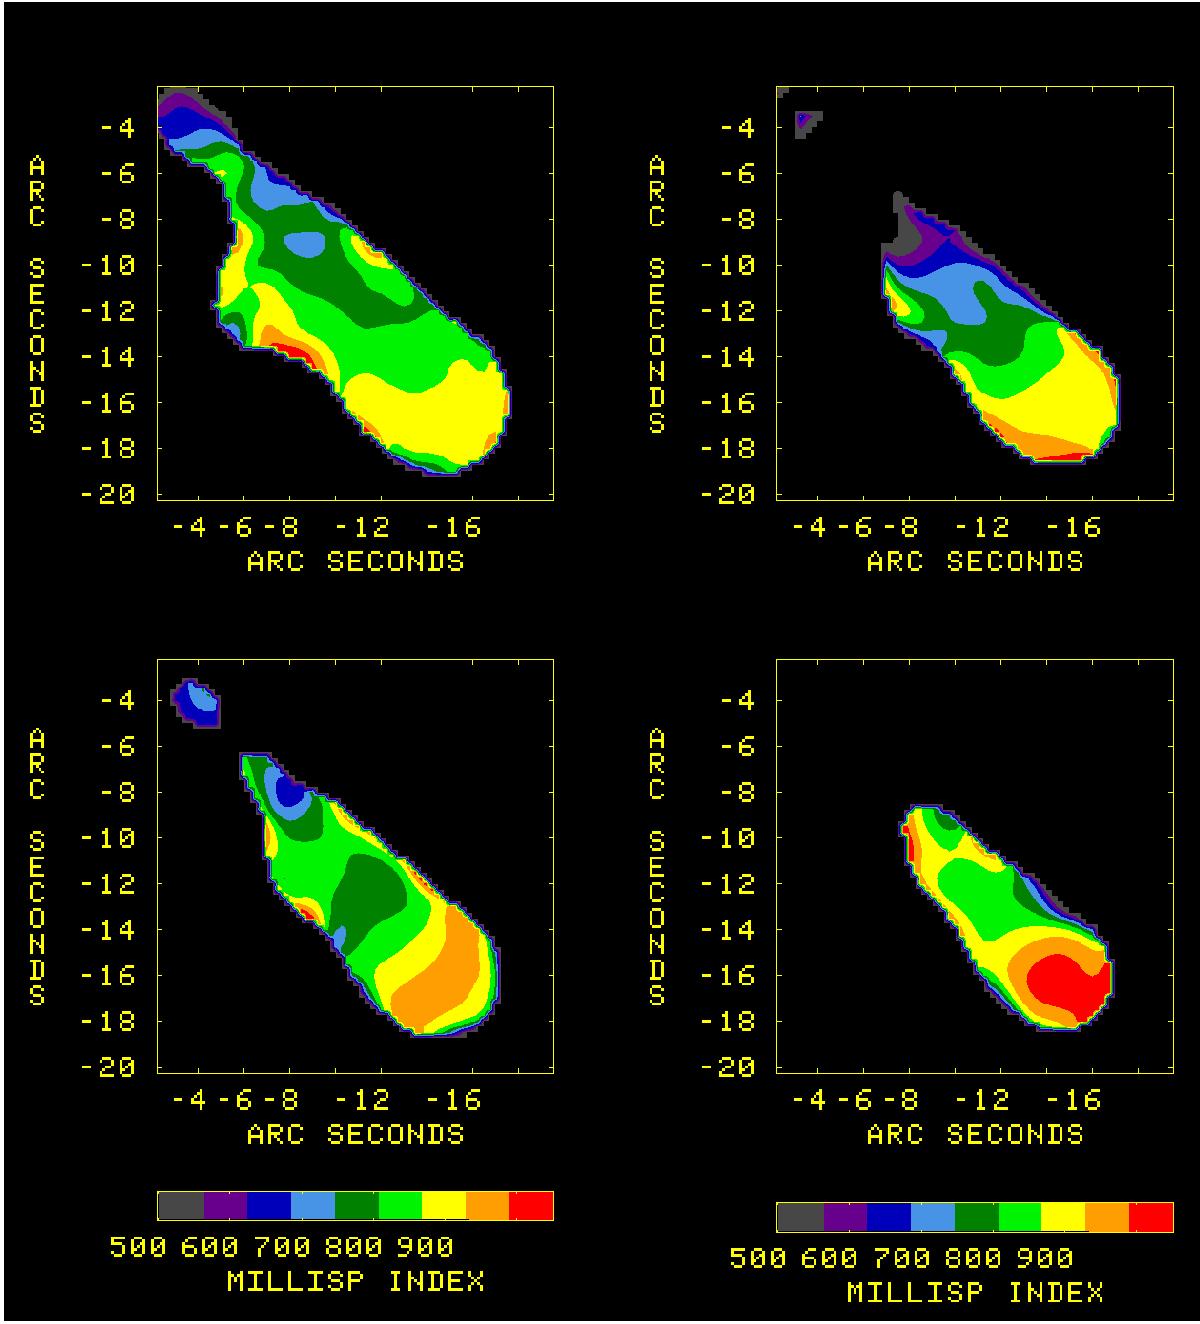
A four-panel figure showing the change in spectral index through the centimeter radio band, at 2.0 arcsec resolution. Upper left: ![]() ; upper right:
; upper right: ![]() ; lower left:
; lower left: ![]() ; lower right:
; lower right: ![]() . These show the dramatic high frequency steepening of the spectrum in the region of the bright radio hot spot. The images are blanked when the errors in spectral index are greater than 0.1.
. These show the dramatic high frequency steepening of the spectrum in the region of the bright radio hot spot. The images are blanked when the errors in spectral index are greater than 0.1.
Current usage metrics show cumulative count of Article Views (full-text article views including HTML views, PDF and ePub downloads, according to the available data) and Abstracts Views on Vision4Press platform.
Data correspond to usage on the plateform after 2015. The current usage metrics is available 48-96 hours after online publication and is updated daily on week days.
Initial download of the metrics may take a while.