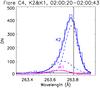
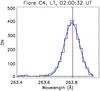
Fig. 8

Left panel: Fe xxiii spectra at the footpoint K1 (pink histogram lines) and K2 (blue histogram line). The blue dashed lines represent the double Gaussian components of the fit and the blue continuous line is the superposition of the two components. Right panel: Fe xxiii spectrum (black histogram line) at the flare loop top (LT, see Fig. 5). The continuous line represents the Gaussian fit. The vertical black lines in the left and right panels indicate the expected rest position of the Fe xxiii line.
Current usage metrics show cumulative count of Article Views (full-text article views including HTML views, PDF and ePub downloads, according to the available data) and Abstracts Views on Vision4Press platform.
Data correspond to usage on the plateform after 2015. The current usage metrics is available 48-96 hours after online publication and is updated daily on week days.
Initial download of the metrics may take a while.