Fig. 7
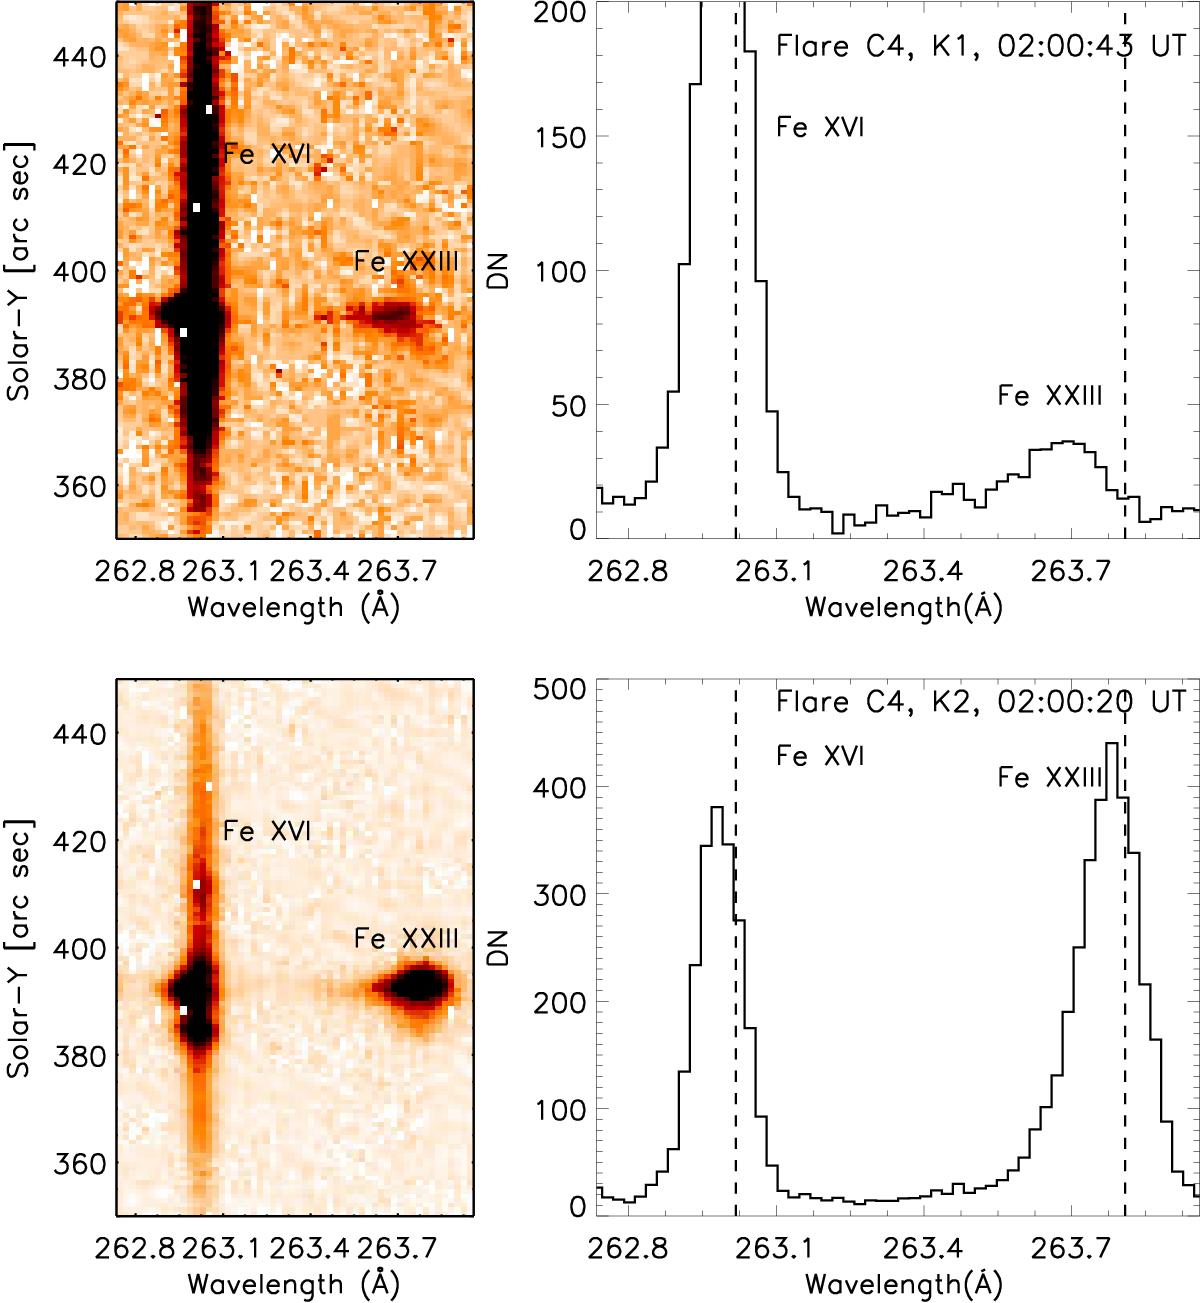
Left panels: CCD detector images at the slit position corresponding to the footpoints K1 (top left) and K2 (bottom left) in Fig. 5. The Fe xvi and Fe xxiii spectral lines are indicated in each image. Right panels: spectra of the Fe xxiii EIS window at the K1 (top right) and K2 (bottom right) footpoints, obtained by averaging over few pixels where the Fe xxiii emission is most visible in the corresponding CCD images on the left.
Current usage metrics show cumulative count of Article Views (full-text article views including HTML views, PDF and ePub downloads, according to the available data) and Abstracts Views on Vision4Press platform.
Data correspond to usage on the plateform after 2015. The current usage metrics is available 48-96 hours after online publication and is updated daily on week days.
Initial download of the metrics may take a while.