Fig. 6
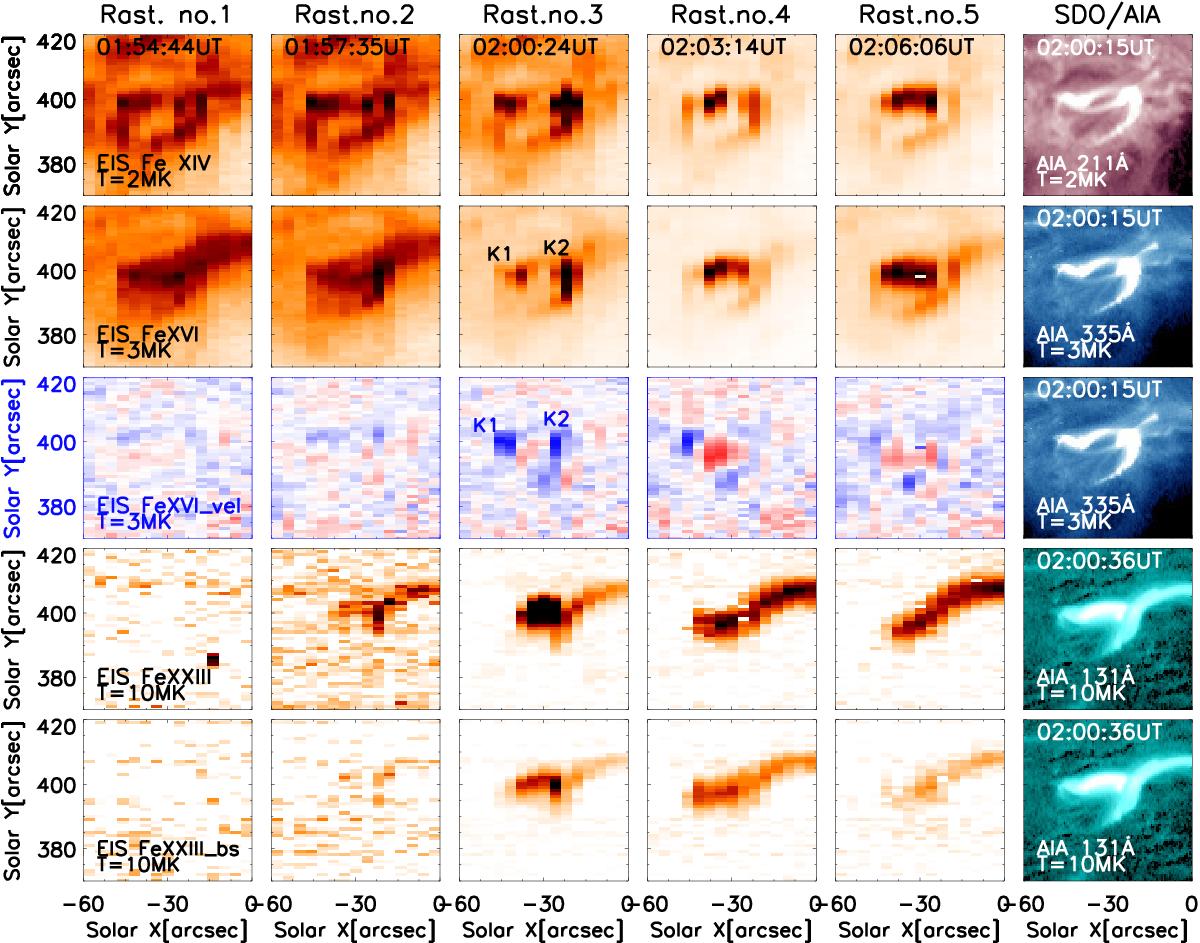
Sequence of EIS maps showing the Fe xiv intensity (first row), Fe xvi intensity (second row), and Doppler shift (from −50 km s-1 to +50 km s-1, third row), Fe xxiii intensity (fourth row) and Fe xxiii blue wing intensity (fifth row, see text) for different rasters over time (from left to right) for the C4.7 class flare. The last column shows the closest AIA images in the 211, 335, and 131 Å filters, to the EIS Raster 3 (middle column). Footpoints K1 and K2 are indicated in the Fe xvi intensity and Doppler shift images in the Raster 3 (third column).
Current usage metrics show cumulative count of Article Views (full-text article views including HTML views, PDF and ePub downloads, according to the available data) and Abstracts Views on Vision4Press platform.
Data correspond to usage on the plateform after 2015. The current usage metrics is available 48-96 hours after online publication and is updated daily on week days.
Initial download of the metrics may take a while.