Free Access
Fig. 5
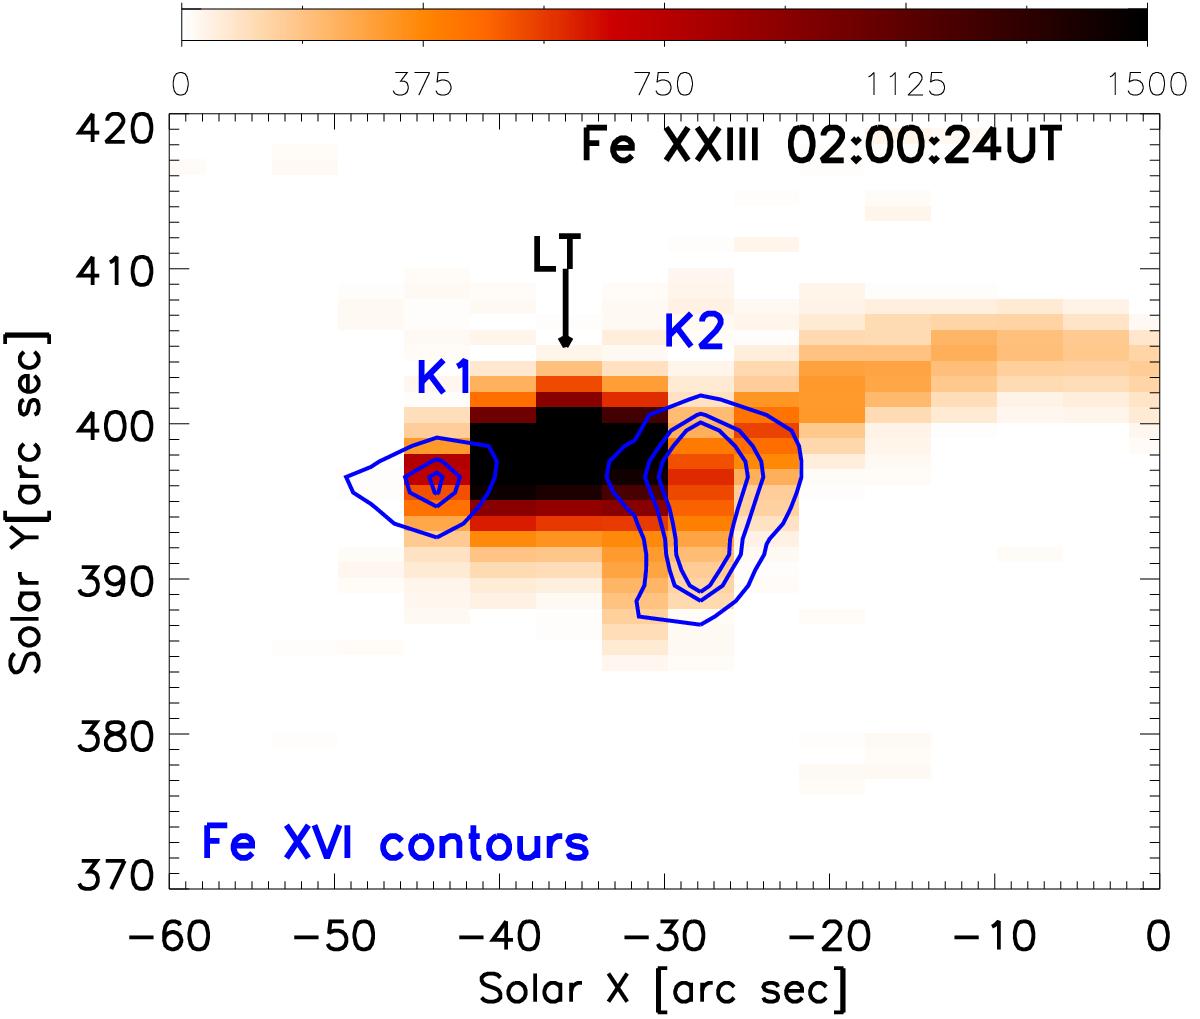
Zoomed EIS intensity image in the Fe xxiii line with an overplot of the intensity contours of the Fe xvi line (blue). The location of the flare kernels K1 and K2 are also indicated in the figure. The flare loop-top is indicated as LT.
Current usage metrics show cumulative count of Article Views (full-text article views including HTML views, PDF and ePub downloads, according to the available data) and Abstracts Views on Vision4Press platform.
Data correspond to usage on the plateform after 2015. The current usage metrics is available 48-96 hours after online publication and is updated daily on week days.
Initial download of the metrics may take a while.