Fig. 4
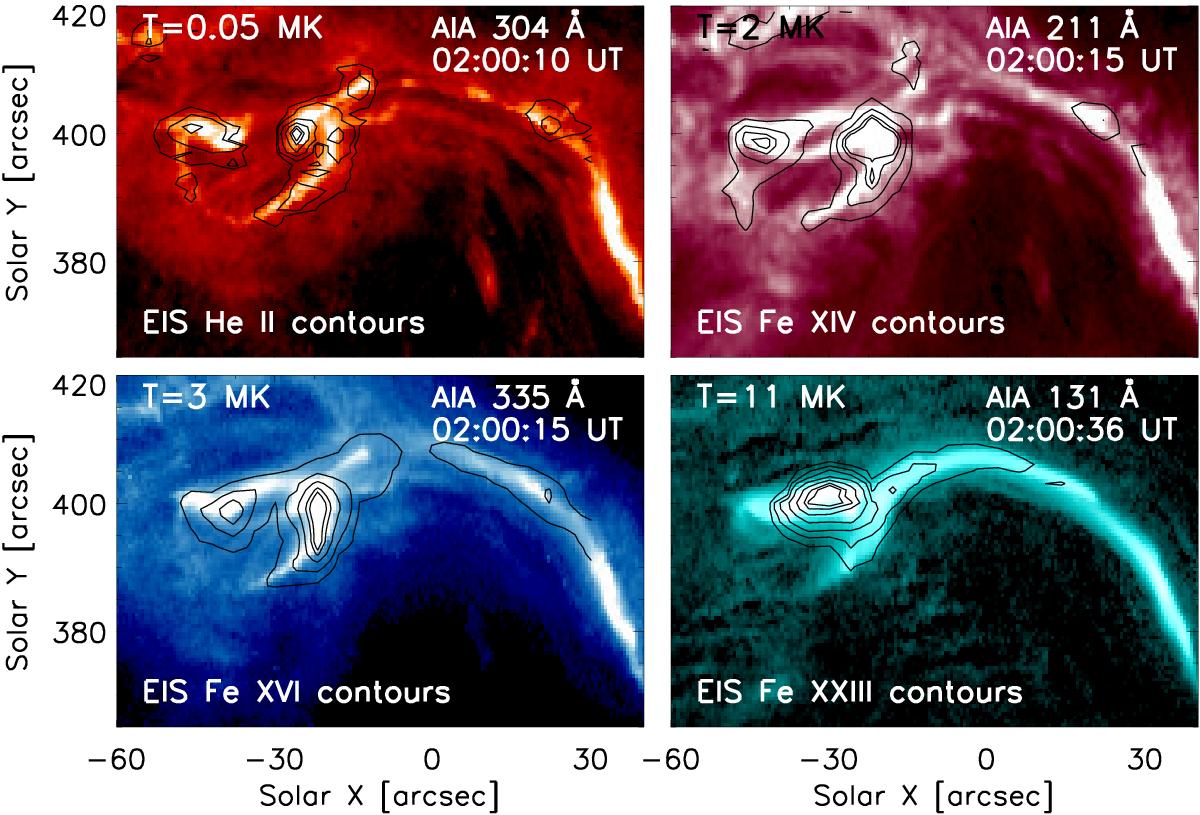
AIA images in the 304 Å (top left), 211 Å (top right), 335 Å (bottom left), and 131 Å (bottom right) filters for the C4.7 class flare. The field of view of these images is shown in Fig. 3. The EIS intensity contours of the He ii, Fe xiv, Fe xvi and Fe xxiii lines, respectively, are overplotted on the AIA images to show the co-alignment between AIA and EIS observations. The temperature of the plasma that dominates the AIA channels is indicated at the top of each image.
Current usage metrics show cumulative count of Article Views (full-text article views including HTML views, PDF and ePub downloads, according to the available data) and Abstracts Views on Vision4Press platform.
Data correspond to usage on the plateform after 2015. The current usage metrics is available 48-96 hours after online publication and is updated daily on week days.
Initial download of the metrics may take a while.