Fig. 3
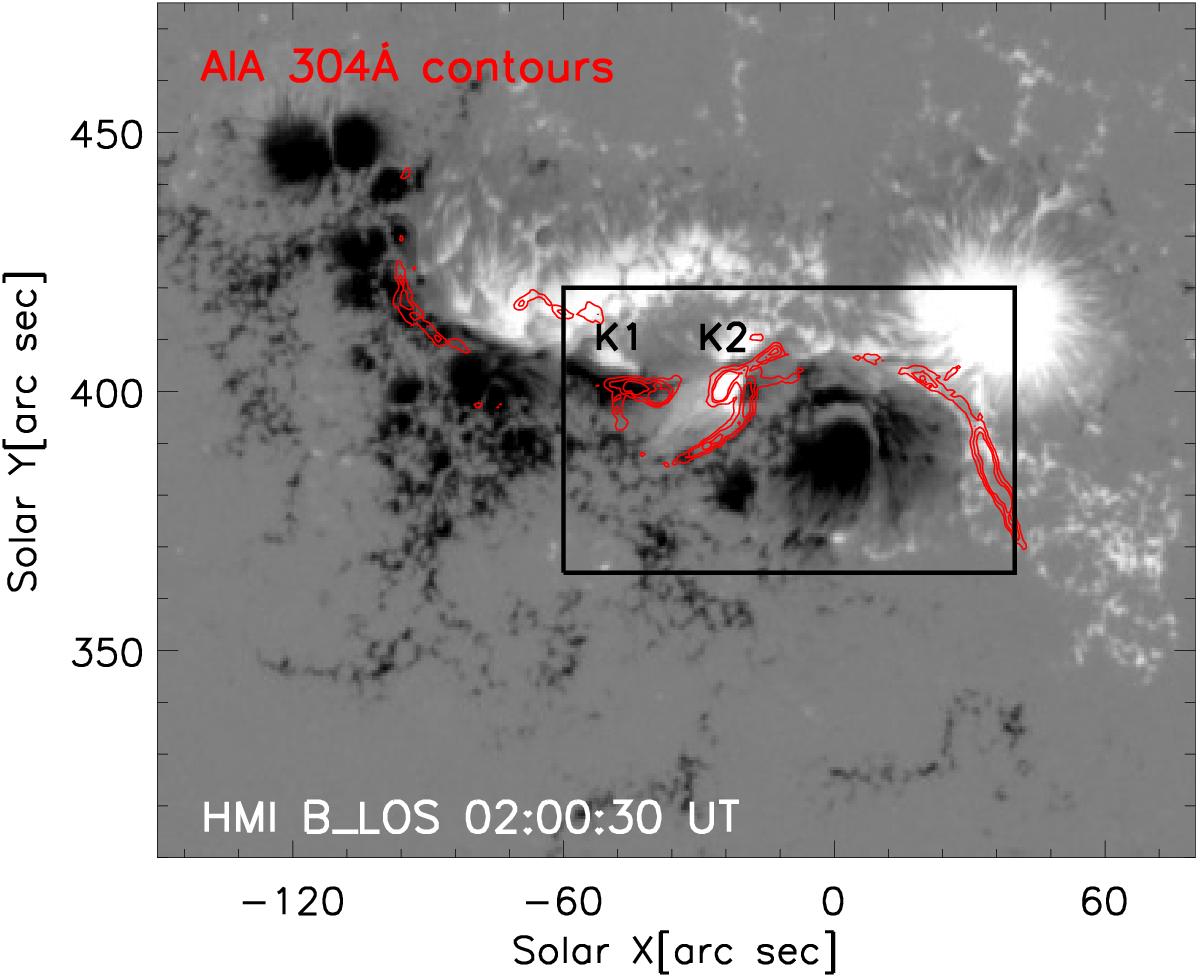
SDO/HMI BLOS image of the AR 11429 during the peak of the C4.7 class flare. The intensity contours of the AIA 304 Å image of the flare are overplotted in red. The position of the flare footpoints K1 and K2 (see Sect. 3) are also indicated, showing that the two footpoints are located in different magnetic polarities. The field of view of the AIA images in Fig. 4 is overlaid as a black boxed area.
Current usage metrics show cumulative count of Article Views (full-text article views including HTML views, PDF and ePub downloads, according to the available data) and Abstracts Views on Vision4Press platform.
Data correspond to usage on the plateform after 2015. The current usage metrics is available 48-96 hours after online publication and is updated daily on week days.
Initial download of the metrics may take a while.