Fig. 2
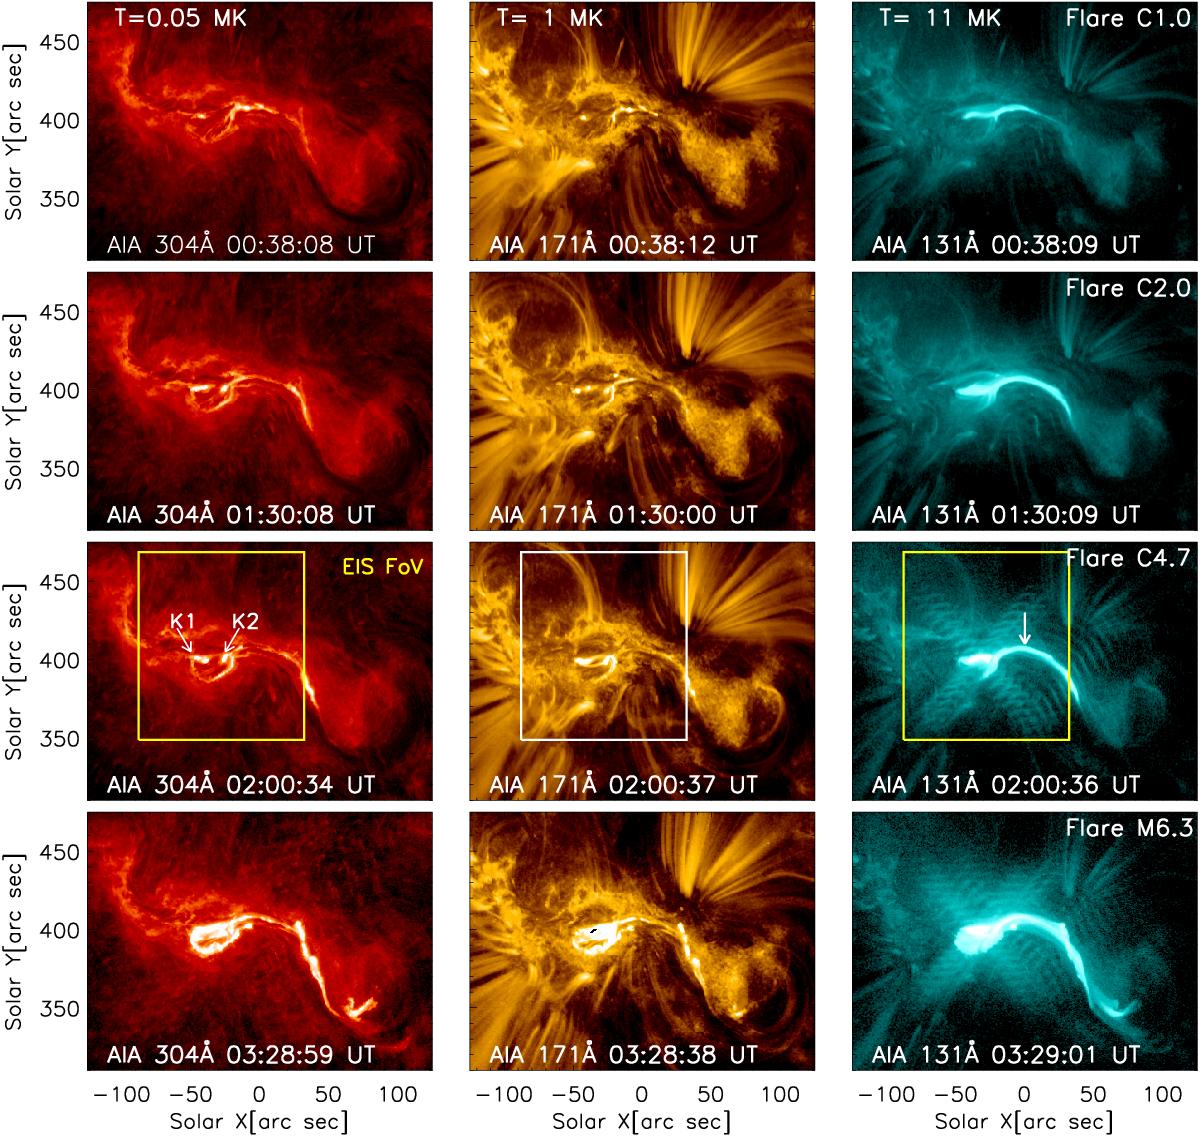
Overview of the C-class recurrent flares on March 9, 2012 as observed by AIA in the following channels: 304 (left column), 171 (middle) and 131 Å (right). The field of view of the EIS spectrometer is indicated by the yellow (and white in the middle column) boxes in the figure. In addition, the locations of the footpoints K1 and K2 (see Sect. 3) are indicated on the 304 Å image in the third row. Finally, the small white arrows in the 131 Å image in the third, fifth, and sixth rows indicate: the spine-like feature, the erupting flux rope, and the slipping motion of the southern flare ribbon respectively, as discussed in the text. The online movie shows the evolution of the 171 and 131 Å AIA images over time. See text for discussion of the rows.
Current usage metrics show cumulative count of Article Views (full-text article views including HTML views, PDF and ePub downloads, according to the available data) and Abstracts Views on Vision4Press platform.
Data correspond to usage on the plateform after 2015. The current usage metrics is available 48-96 hours after online publication and is updated daily on week days.
Initial download of the metrics may take a while.