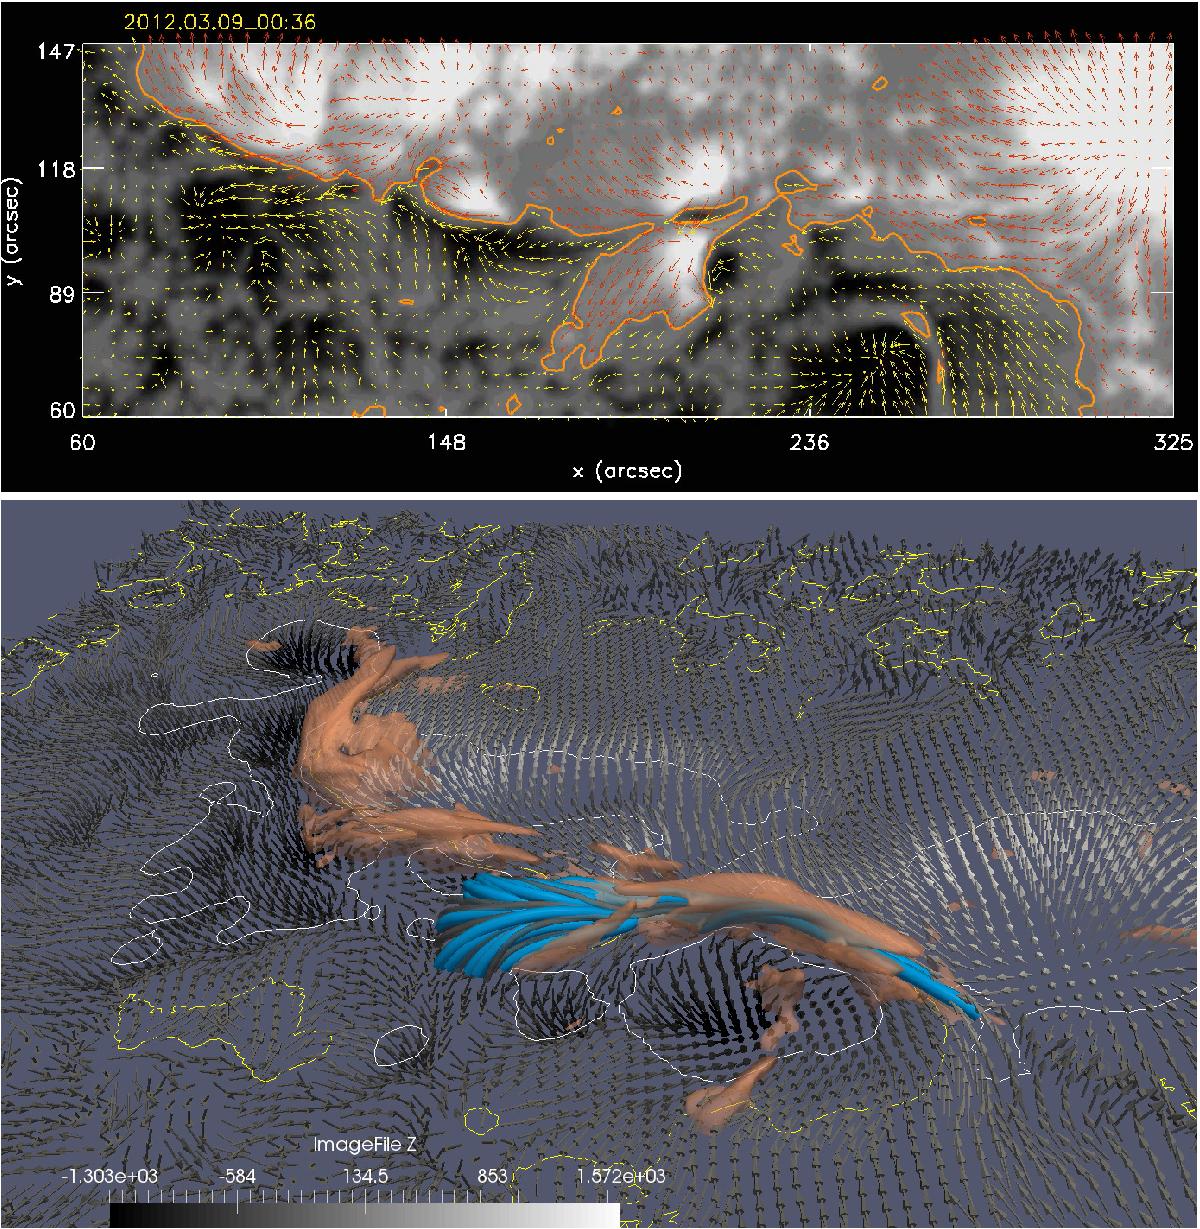
Fig. 18

Top panel: photospheric field just before the beginning of the C1.0 class flare as observed by SDO/HMI. The red/yellow arrows represent the transverse components of the magnetic field starting from negative/positive Bz values. The orange line is the PIL. Bottom panel: spine-like structure and its surrounding current envelope. The current density is represented by the brownish semi-transparent isosurface (at 26% of its peak volume).
Current usage metrics show cumulative count of Article Views (full-text article views including HTML views, PDF and ePub downloads, according to the available data) and Abstracts Views on Vision4Press platform.
Data correspond to usage on the plateform after 2015. The current usage metrics is available 48-96 hours after online publication and is updated daily on week days.
Initial download of the metrics may take a while.


