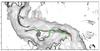
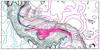
Fig. 17
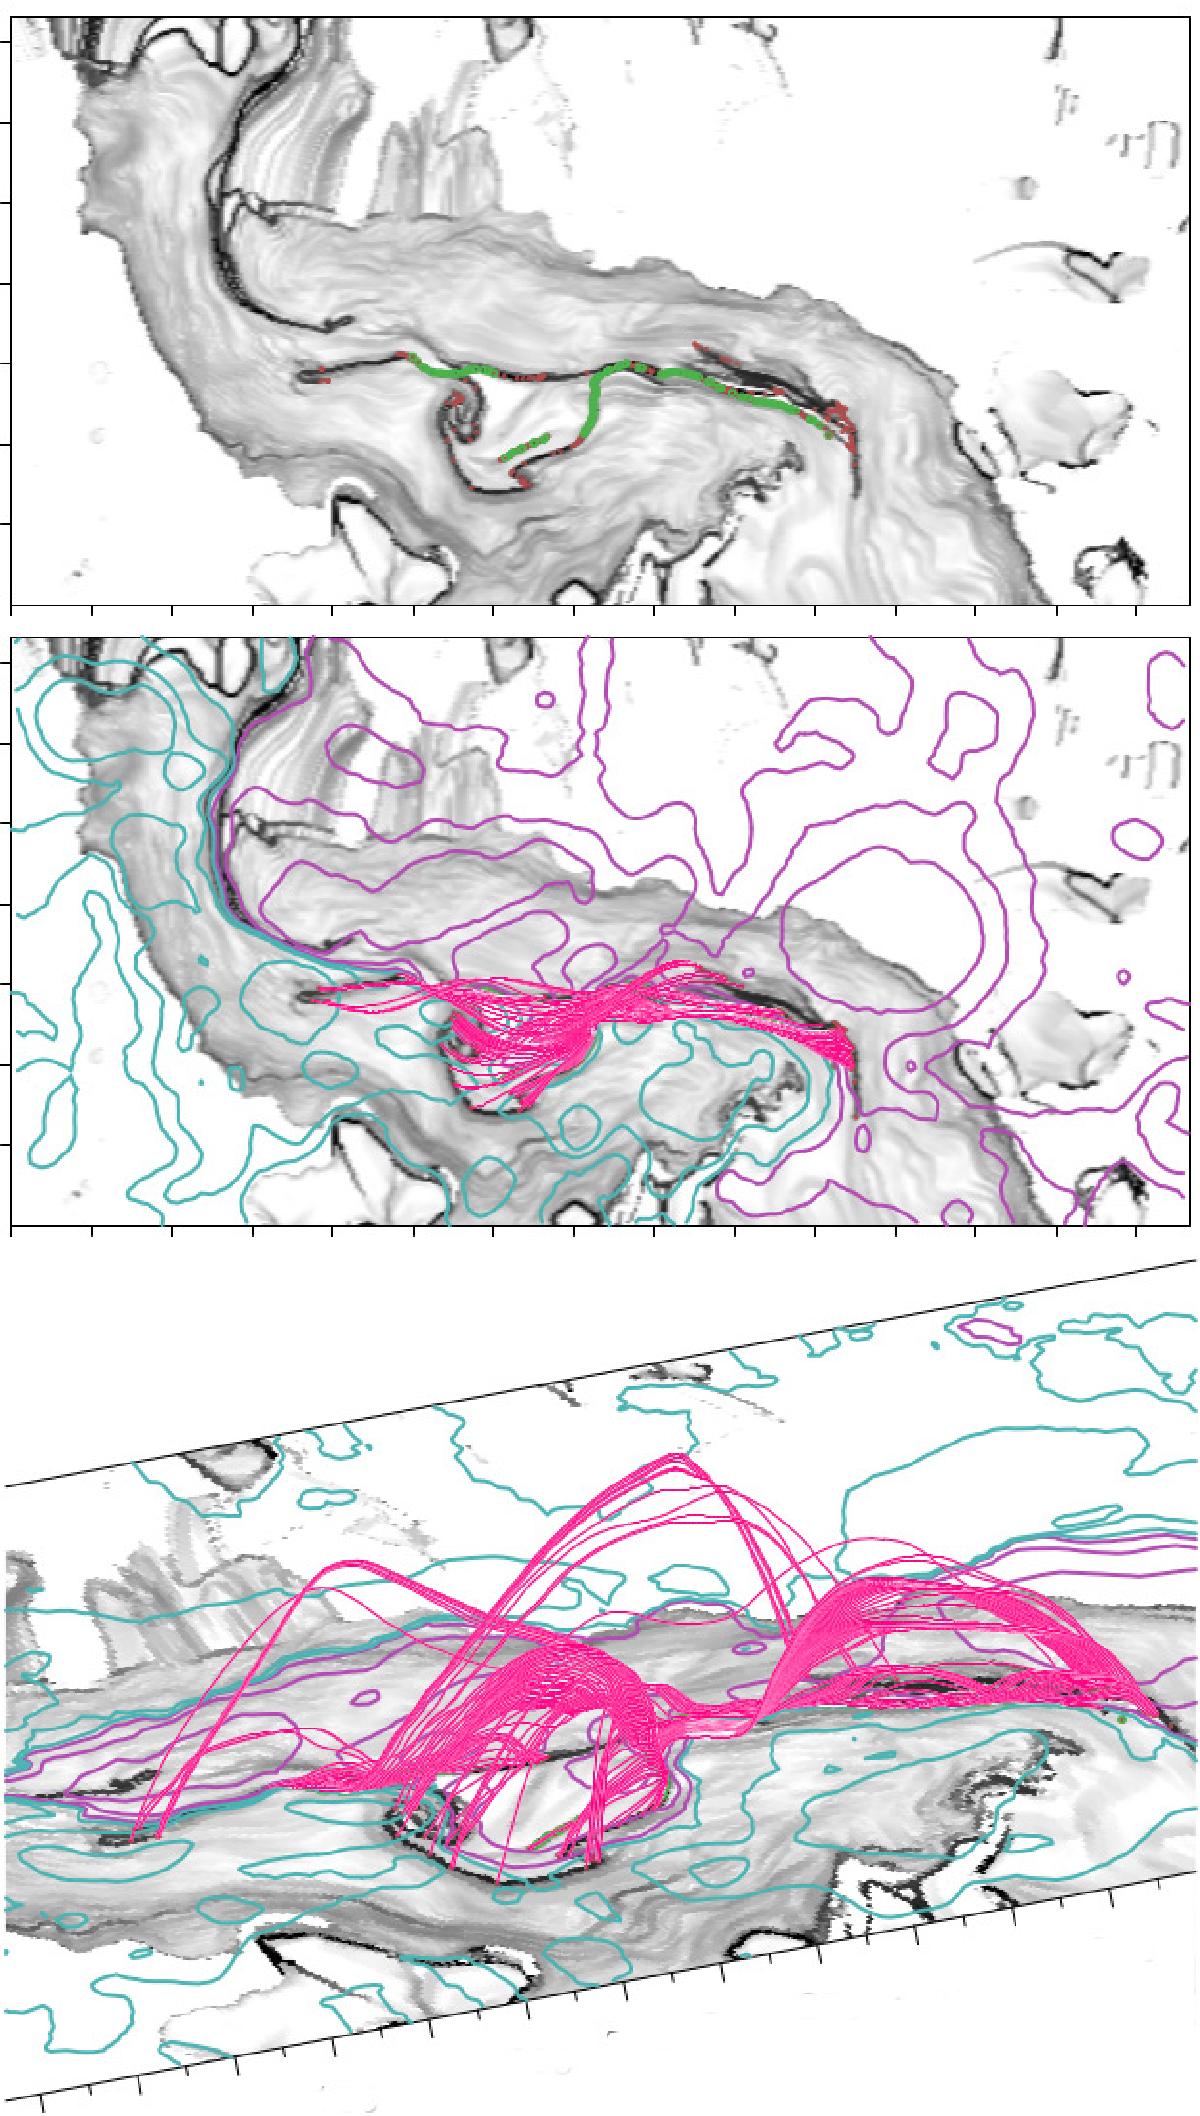
Top panel: photospheric distribution of squashing factor Q, with the bald patch locations (green dots) overlaid. Middle panel: photospheric squashing degree, with bald-patch separatrix field lines and isocontours of Bz overlaid. The bald-patch separatrix field lines are traced from the bald patch locations (green dots) shown on the top panel. Bottom panel: side view of the bald-patch separatrix lines.
Current usage metrics show cumulative count of Article Views (full-text article views including HTML views, PDF and ePub downloads, according to the available data) and Abstracts Views on Vision4Press platform.
Data correspond to usage on the plateform after 2015. The current usage metrics is available 48-96 hours after online publication and is updated daily on week days.
Initial download of the metrics may take a while.