Free Access
Fig. 14
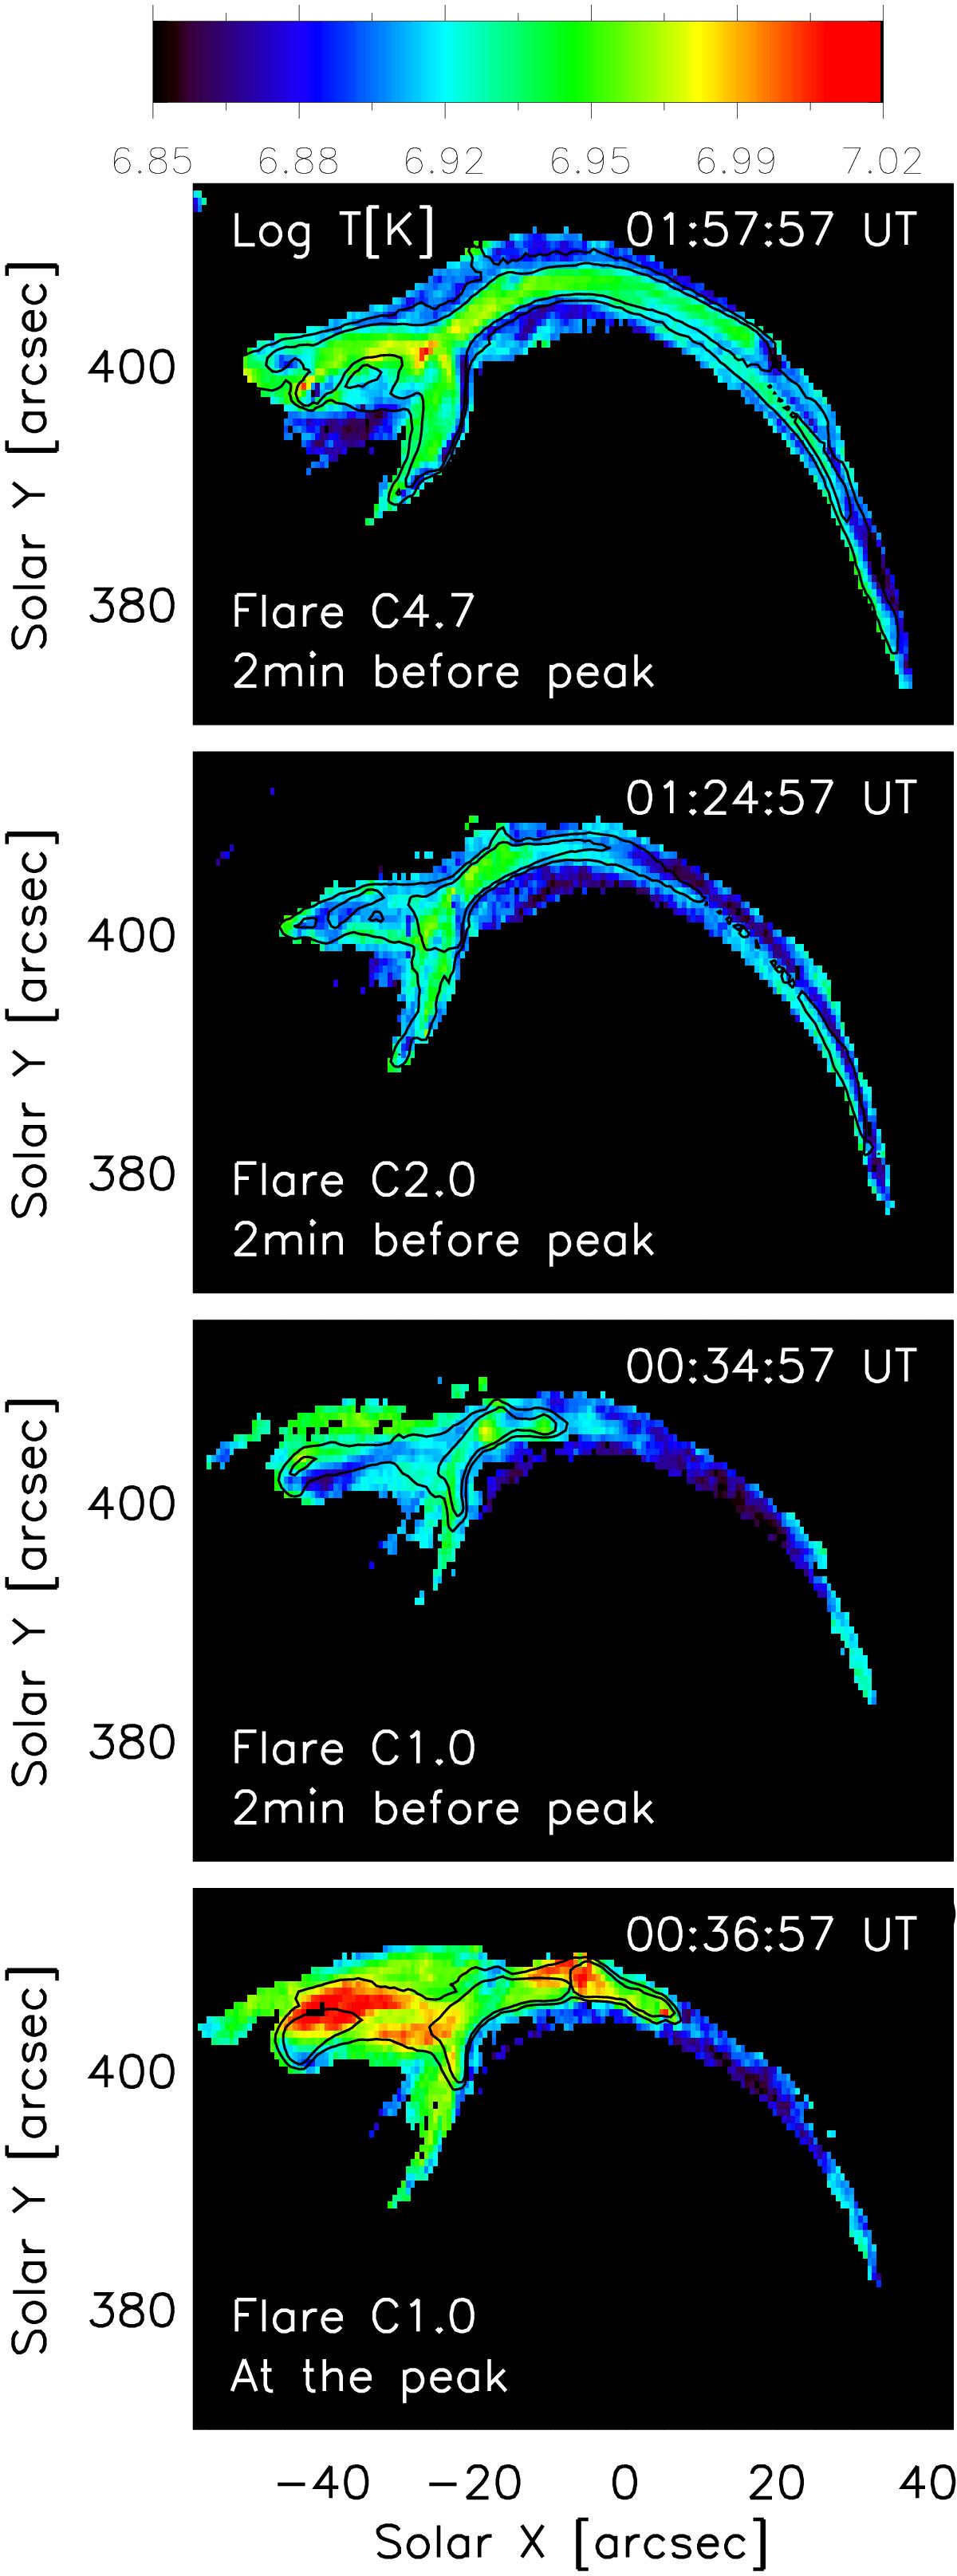
Temperature maps (in Log scale) of the three C-class flares obtained from the 131 and 94 Å AIA filter ratio two minutes before the peak time for each flare (C4.7, C2.0 and C1.0) and at the peak of the C1.0 flare. The intensity contours of the 131 Å channel are overplotted in each panel.
Current usage metrics show cumulative count of Article Views (full-text article views including HTML views, PDF and ePub downloads, according to the available data) and Abstracts Views on Vision4Press platform.
Data correspond to usage on the plateform after 2015. The current usage metrics is available 48-96 hours after online publication and is updated daily on week days.
Initial download of the metrics may take a while.