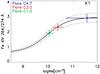
Fig. 13
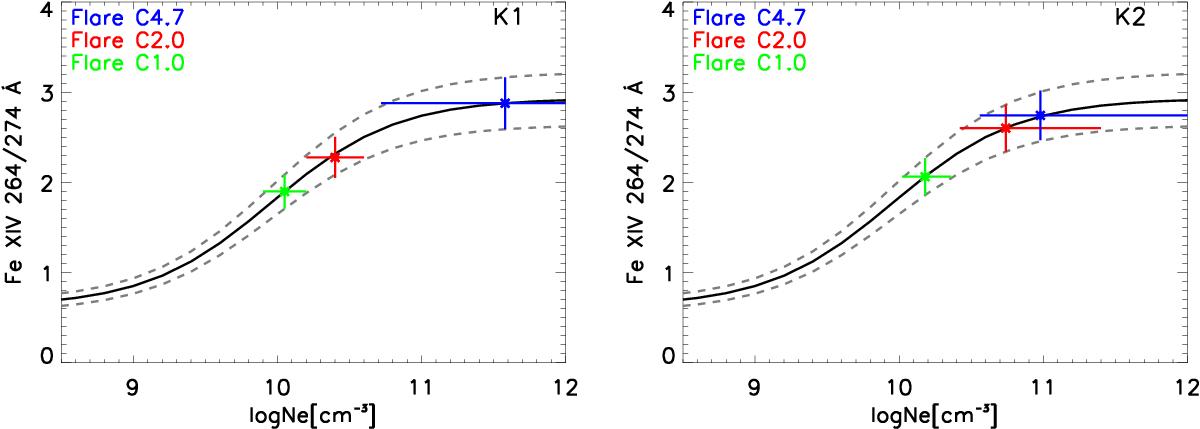
Maximum density estimates based on the measurements of the Fe xiv 264/274 Å ratio during the three C-class flares, as indicated by different coloured points and associated error bars (as described in the legend on each image) for the footpoints K1 (left panel) and K2 (right panel). The solid black curve indicates the theoretical ratio calculated using CHIANTI v8 atomic database. The gray dotted curves represent a ±10% error in the theoretical ratio.
Current usage metrics show cumulative count of Article Views (full-text article views including HTML views, PDF and ePub downloads, according to the available data) and Abstracts Views on Vision4Press platform.
Data correspond to usage on the plateform after 2015. The current usage metrics is available 48-96 hours after online publication and is updated daily on week days.
Initial download of the metrics may take a while.