Fig. 8
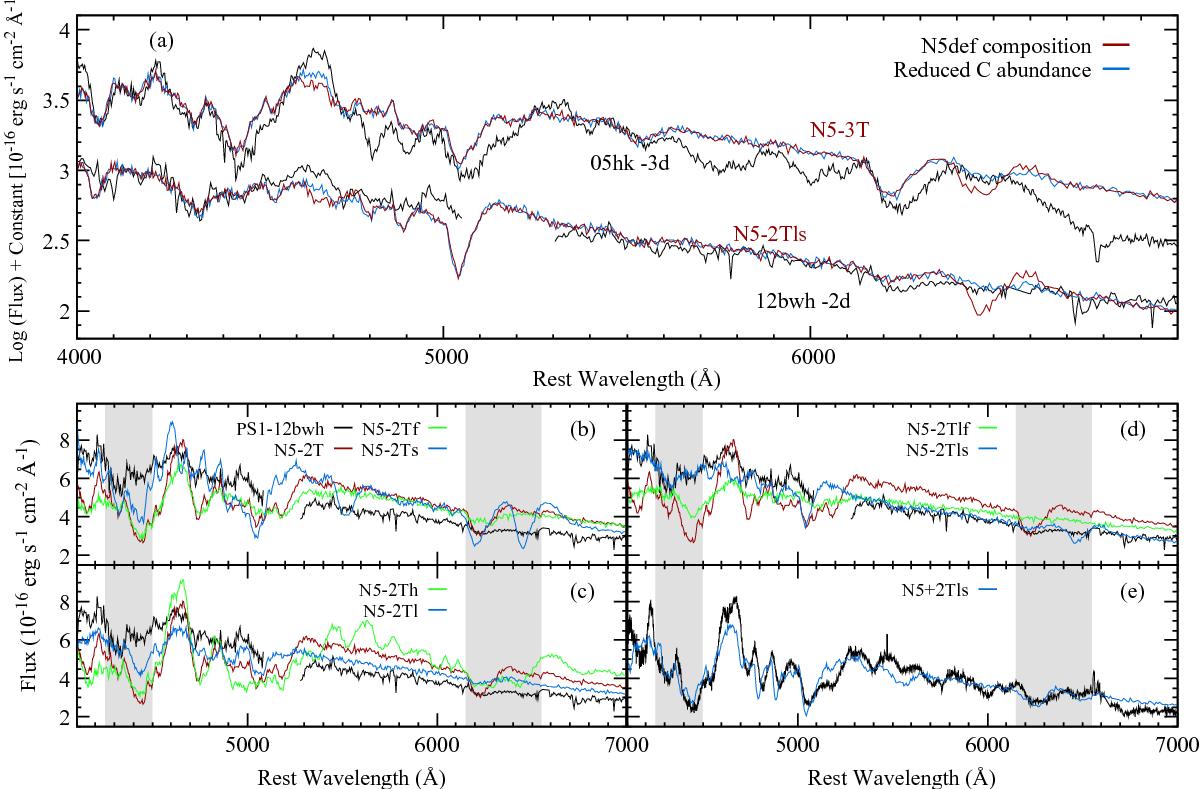
Spectroscopic comparison of PS1-12bwh and SN 2005hk to TARDIS model spectra. The spectra of PS1-12bwh have been binned to Δλ = 5, and the narrow host emission lines have been removed. Panel a) shows the comparison of our favoured models in red (N5-3T and N5-2Tls) to observations in black. Spectra in blue show our favoured models with a carbon abundance reduced by an order of magnitude. The only difference in the resultant spectrum is the decreased strength of the C ii λ6580 feature. In panels b), c), and d), the N5-2T model is shown for reference. Green and blue spectra demonstrate the effects of changing certain physical parameters (see Table 3) on the resultant synthetic spectrum. As in panel a), comparisons are to the −2 d PS1-12bwh spectrum. Shaded regions indicate the Fe ii and Fe iii, and Si ii and C ii features that we use to define a satisfactory model (see Sect. 4.3). Panel e) shows a direct comparison of the N5+2Tls model spectrum to the + 2 d spectrum of PS1-12bwh.
Current usage metrics show cumulative count of Article Views (full-text article views including HTML views, PDF and ePub downloads, according to the available data) and Abstracts Views on Vision4Press platform.
Data correspond to usage on the plateform after 2015. The current usage metrics is available 48-96 hours after online publication and is updated daily on week days.
Initial download of the metrics may take a while.