Fig. 5
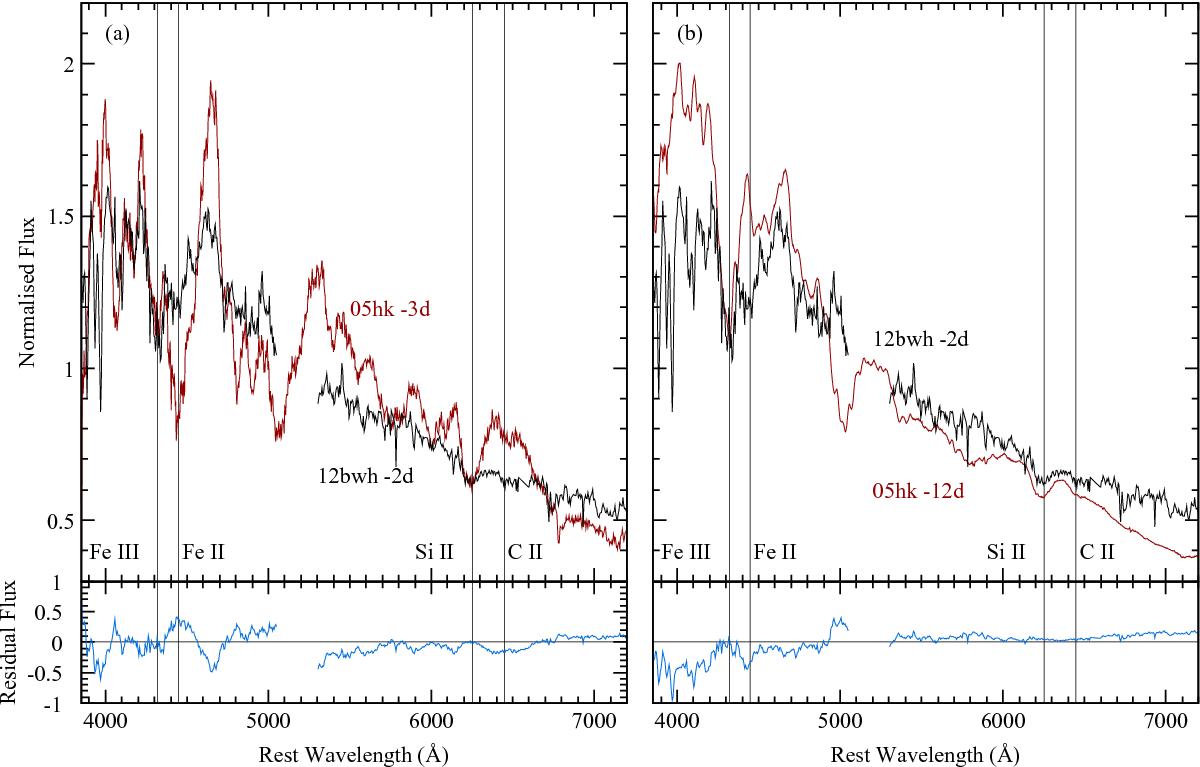
Comparison of the −2 d PS1-12bwh spectrum to two pre-maximum epochs of SN 2005hk. The spectrum of PS1-12bwh has been binned to Δλ = 5 Å and the narrow host emission lines have been removed. All spectra were normalised by the average continuum flux. The gap in the PS1-12bwh spectrum around 5200 Å is due to the dichroic used. The lower panels show the residuals resulting from taking the difference between the spectra in the respective upper panel, confirming that the −2 d PS1-12bwh spectrum is a better spectroscopic match for the −12 d SN 2005hk spectrum, than the similarly phased −3 d spectrum. Features of interest are indicated by full vertical lines. The original data sources for spectra of SN 2005hk are given in Table A.3.
Current usage metrics show cumulative count of Article Views (full-text article views including HTML views, PDF and ePub downloads, according to the available data) and Abstracts Views on Vision4Press platform.
Data correspond to usage on the plateform after 2015. The current usage metrics is available 48-96 hours after online publication and is updated daily on week days.
Initial download of the metrics may take a while.