Fig. 2
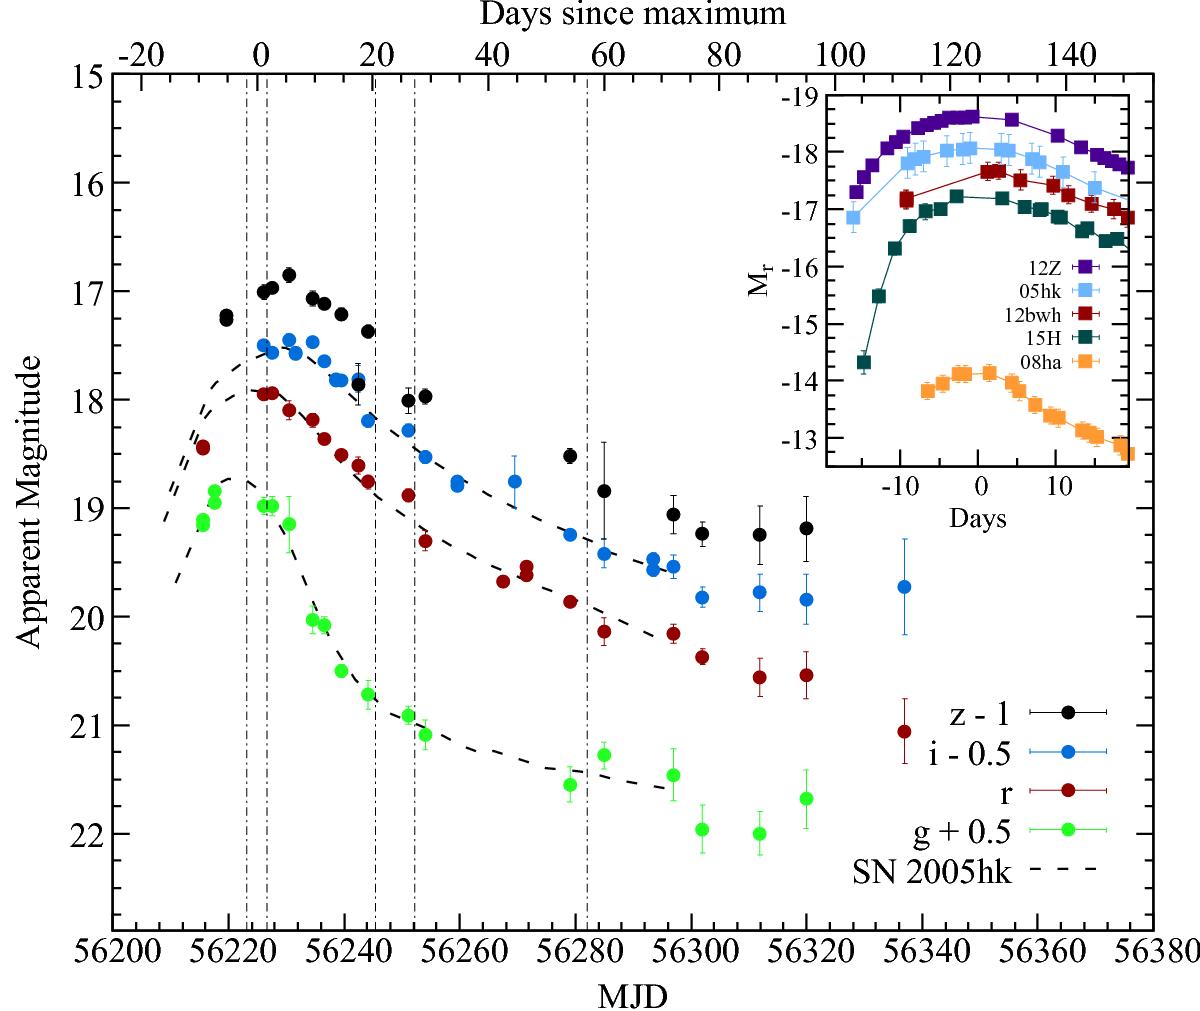
Light curves of PS1-12bwh. Epochs of spectroscopic observations are marked with dot-dashed vertical lines. Light curves of SN 2005hk in the natural system (Stritzinger et al. 2015) have been shifted in time and magnitude to match the light curves of PS1-12bwh, and are shown for comparison as dashed lines. Inset: absolute r-band magnitude light curves of PS1-12bwh and comparison objects used throughout this paper. We limit this comparison to ±20 d relative to r-band maximum as an indication of the rise and decline of these objects. With the exception of SN 2008ha, all objects have comparable decline rates in the r-band, from 0.60 (PS1-12bwh) to 0.70 (SN 2005hk, Stritzinger et al. 2015) and a spread of absolute peak magnitudes, from Mr ~ −17.3 (SN 2015H, Magee et al. 2016) to Mr ~ −18.6 (SN 2012Z, Stritzinger et al. 2015). These values can be compared with Mr ~ −19.24 for SNe Ia (Hicken et al. 2009). Data sources are listed in Table A.3.
Current usage metrics show cumulative count of Article Views (full-text article views including HTML views, PDF and ePub downloads, according to the available data) and Abstracts Views on Vision4Press platform.
Data correspond to usage on the plateform after 2015. The current usage metrics is available 48-96 hours after online publication and is updated daily on week days.
Initial download of the metrics may take a while.