Free Access
Fig. 8
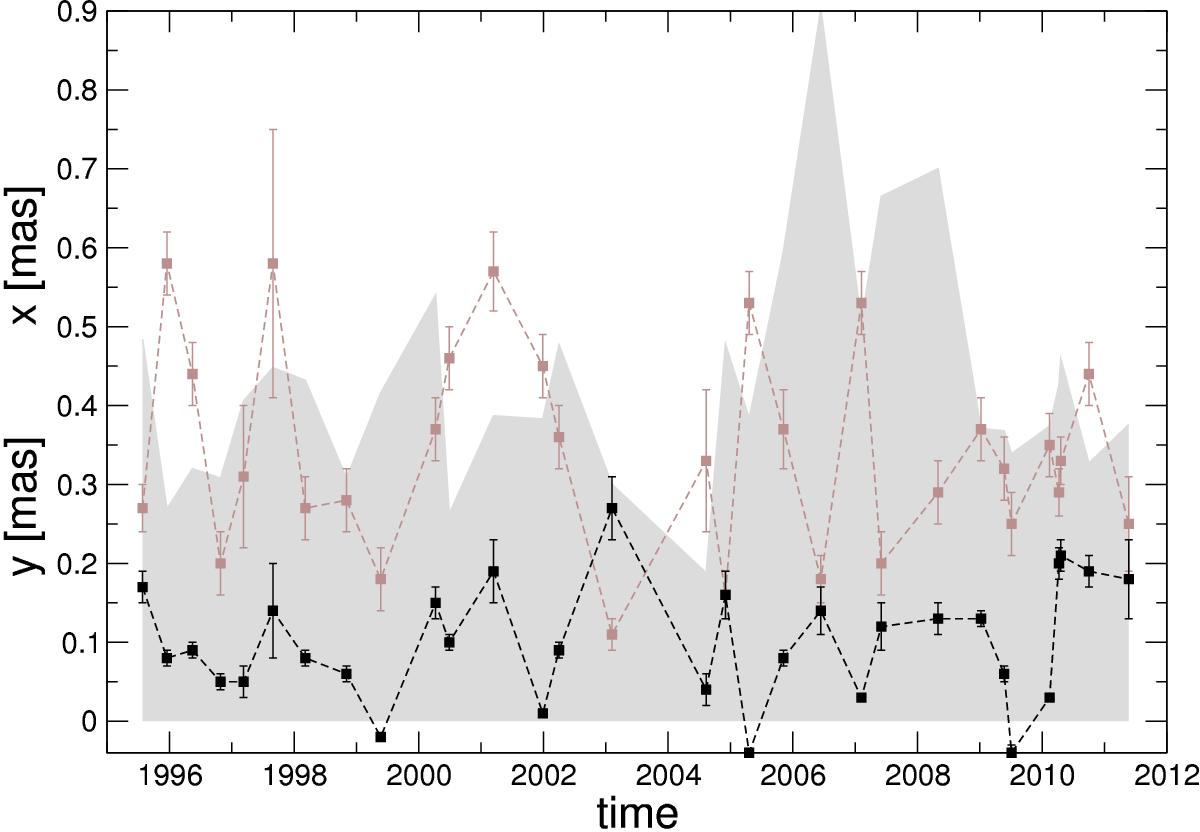
Closest jet component to the core per epoch as function of time, connected by a line. Both coordinates (x,y) are shown as function of time. The flux-density of the displayed components is shown in the background (gray). The y-axis denotes for three parameters: x [mas], y [mas], and flux-density [Jy] (not marked).
Current usage metrics show cumulative count of Article Views (full-text article views including HTML views, PDF and ePub downloads, according to the available data) and Abstracts Views on Vision4Press platform.
Data correspond to usage on the plateform after 2015. The current usage metrics is available 48-96 hours after online publication and is updated daily on week days.
Initial download of the metrics may take a while.