Free Access
Fig. 4
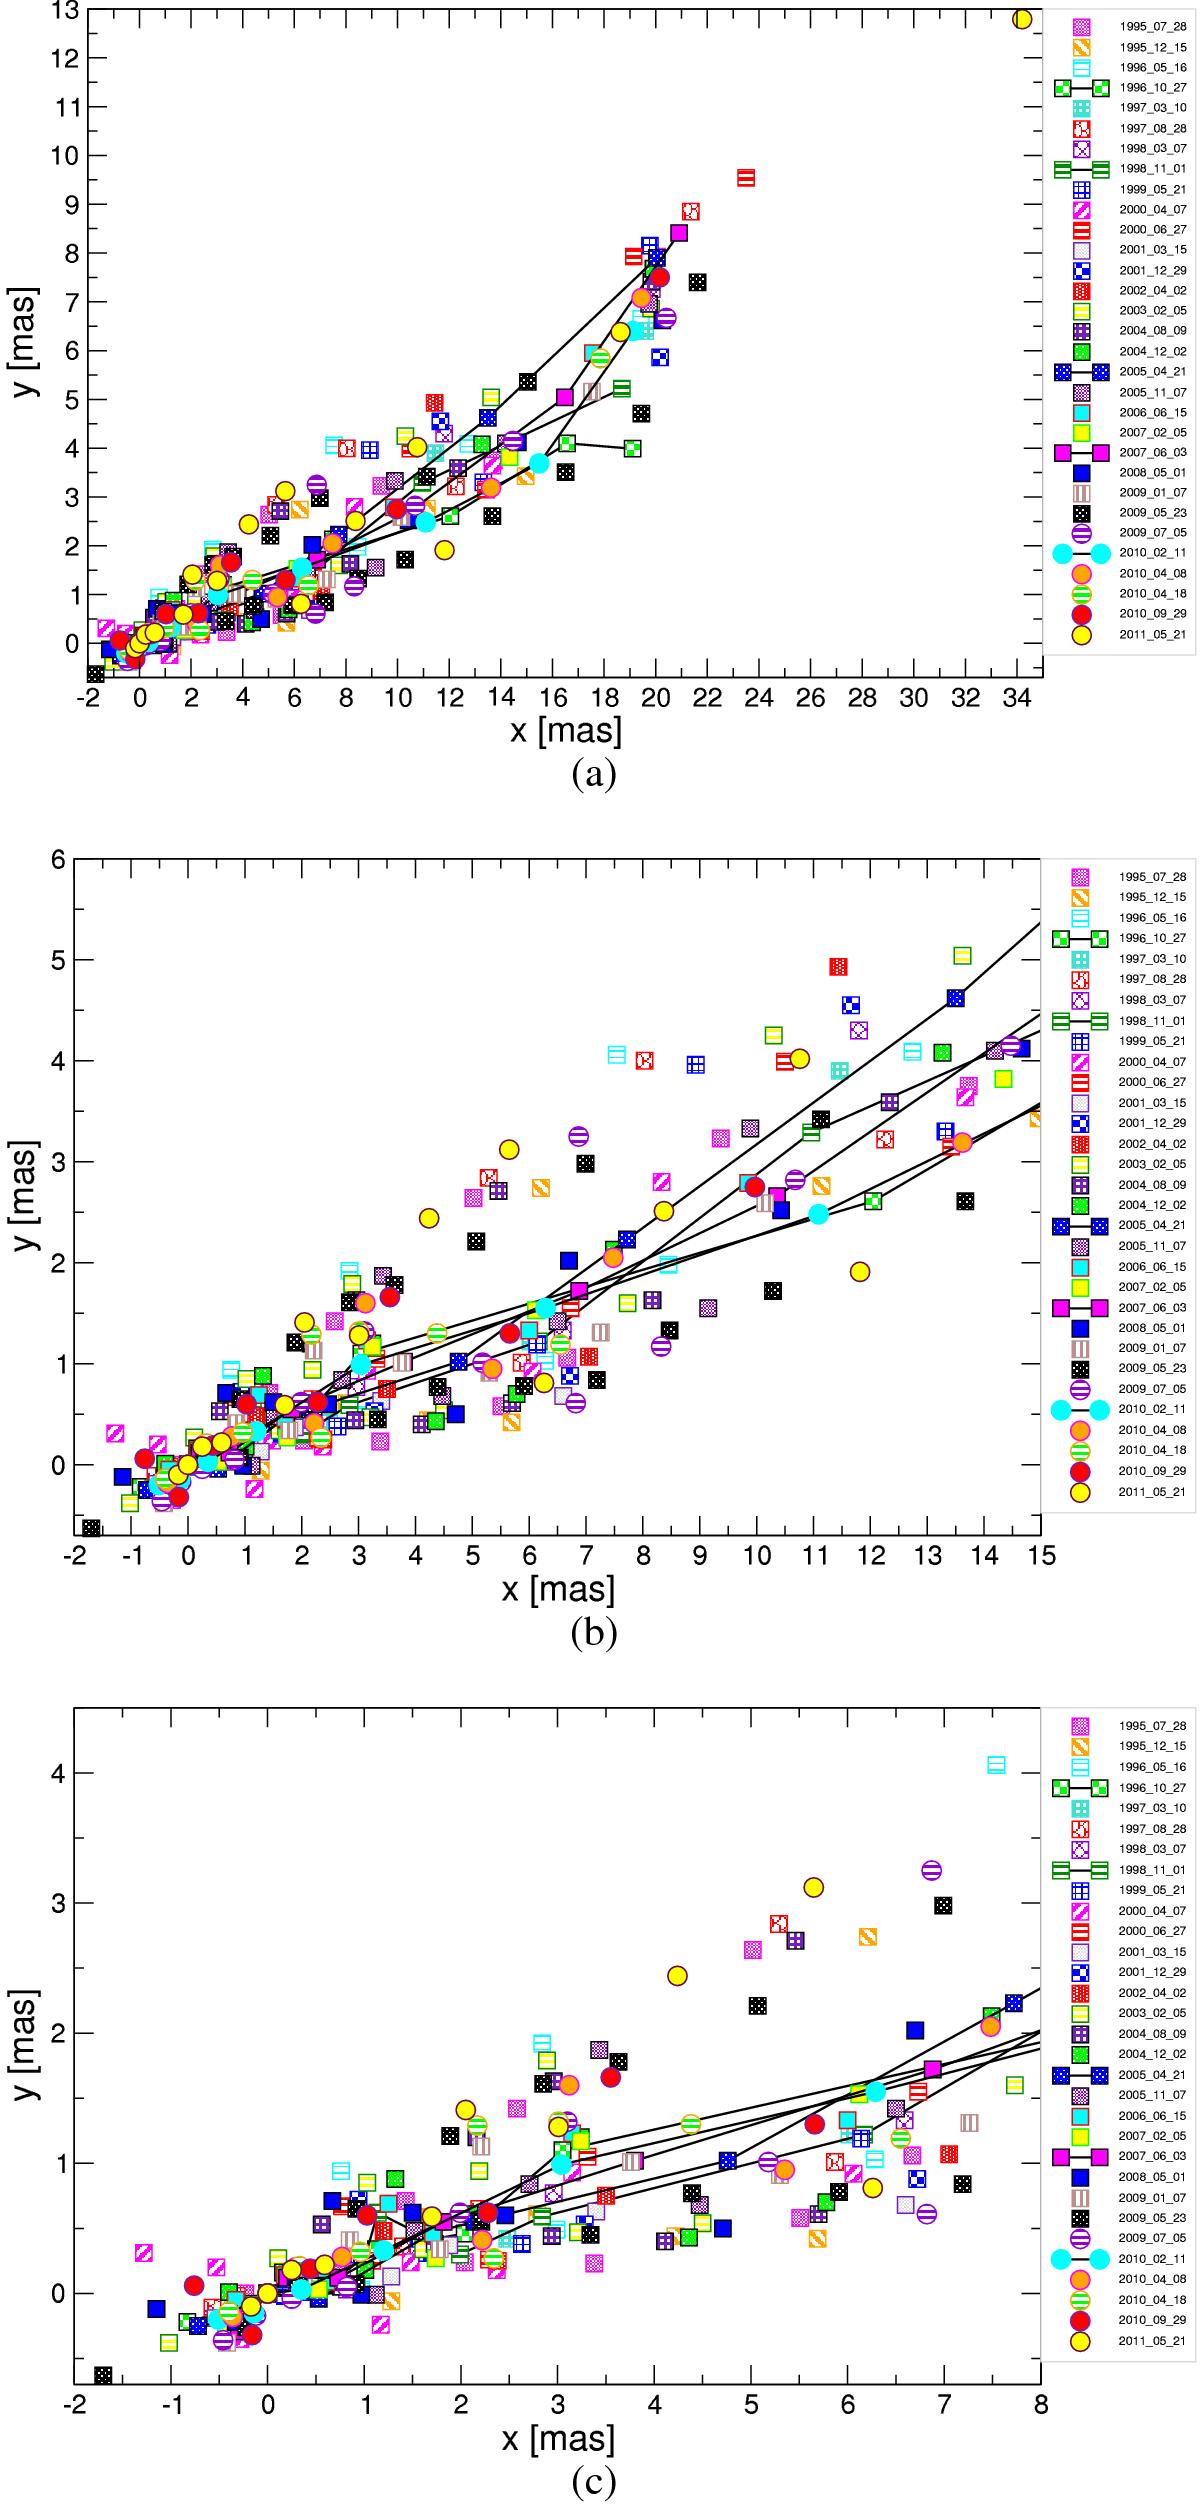
Plot a) all components found in the model-fitting process in x versus y (upper plot). Plots b) and c) zoom into the inner 15 mas in xb) and 8 mas c). All epochs are marked with different symbols and colours and the straight phases are highlighted with solid black lines.
This figure is made of several images, please see below:
Current usage metrics show cumulative count of Article Views (full-text article views including HTML views, PDF and ePub downloads, according to the available data) and Abstracts Views on Vision4Press platform.
Data correspond to usage on the plateform after 2015. The current usage metrics is available 48-96 hours after online publication and is updated daily on week days.
Initial download of the metrics may take a while.