Fig. 21
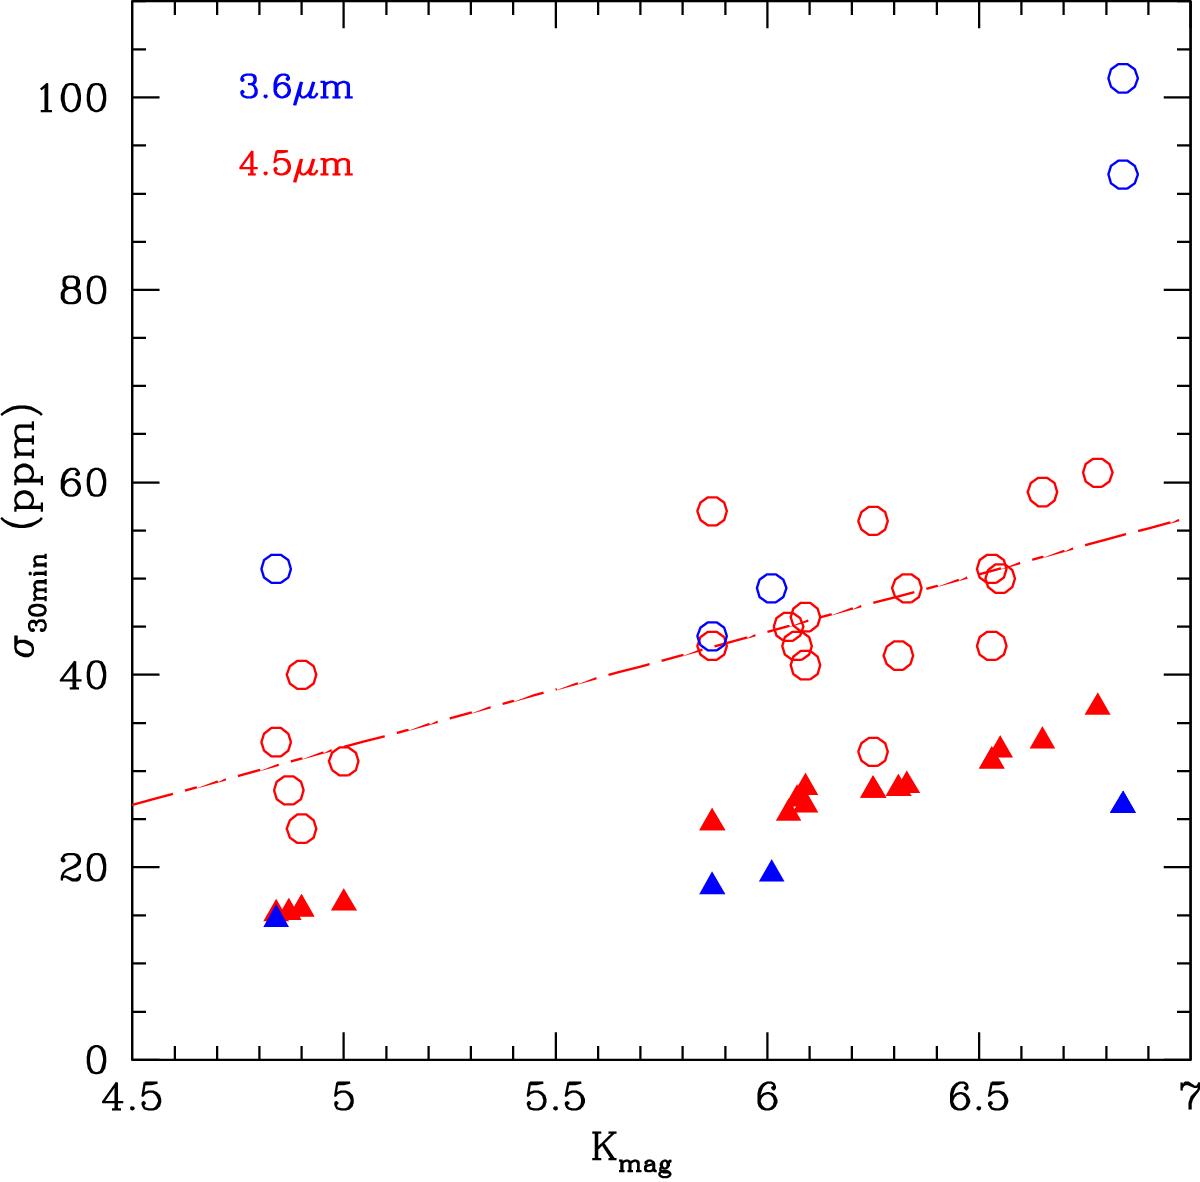
Standard deviations of the detrended Spitzer photometry binned per 30 min (open circles) and the corresponding formal errors (triangles) as a function of the K-magnitude of the targets. Blue = 3.6 μm, red = 4.5 μm. The dashed red line shows the best-fit linear relationship between the standard deviations measured at 4.5 μm and the K-magnitudes, its equation being σ30 min = 32.5 + 11.97 × (Kmag−5) ppm.
Current usage metrics show cumulative count of Article Views (full-text article views including HTML views, PDF and ePub downloads, according to the available data) and Abstracts Views on Vision4Press platform.
Data correspond to usage on the plateform after 2015. The current usage metrics is available 48-96 hours after online publication and is updated daily on week days.
Initial download of the metrics may take a while.