Free Access
Fig. 2
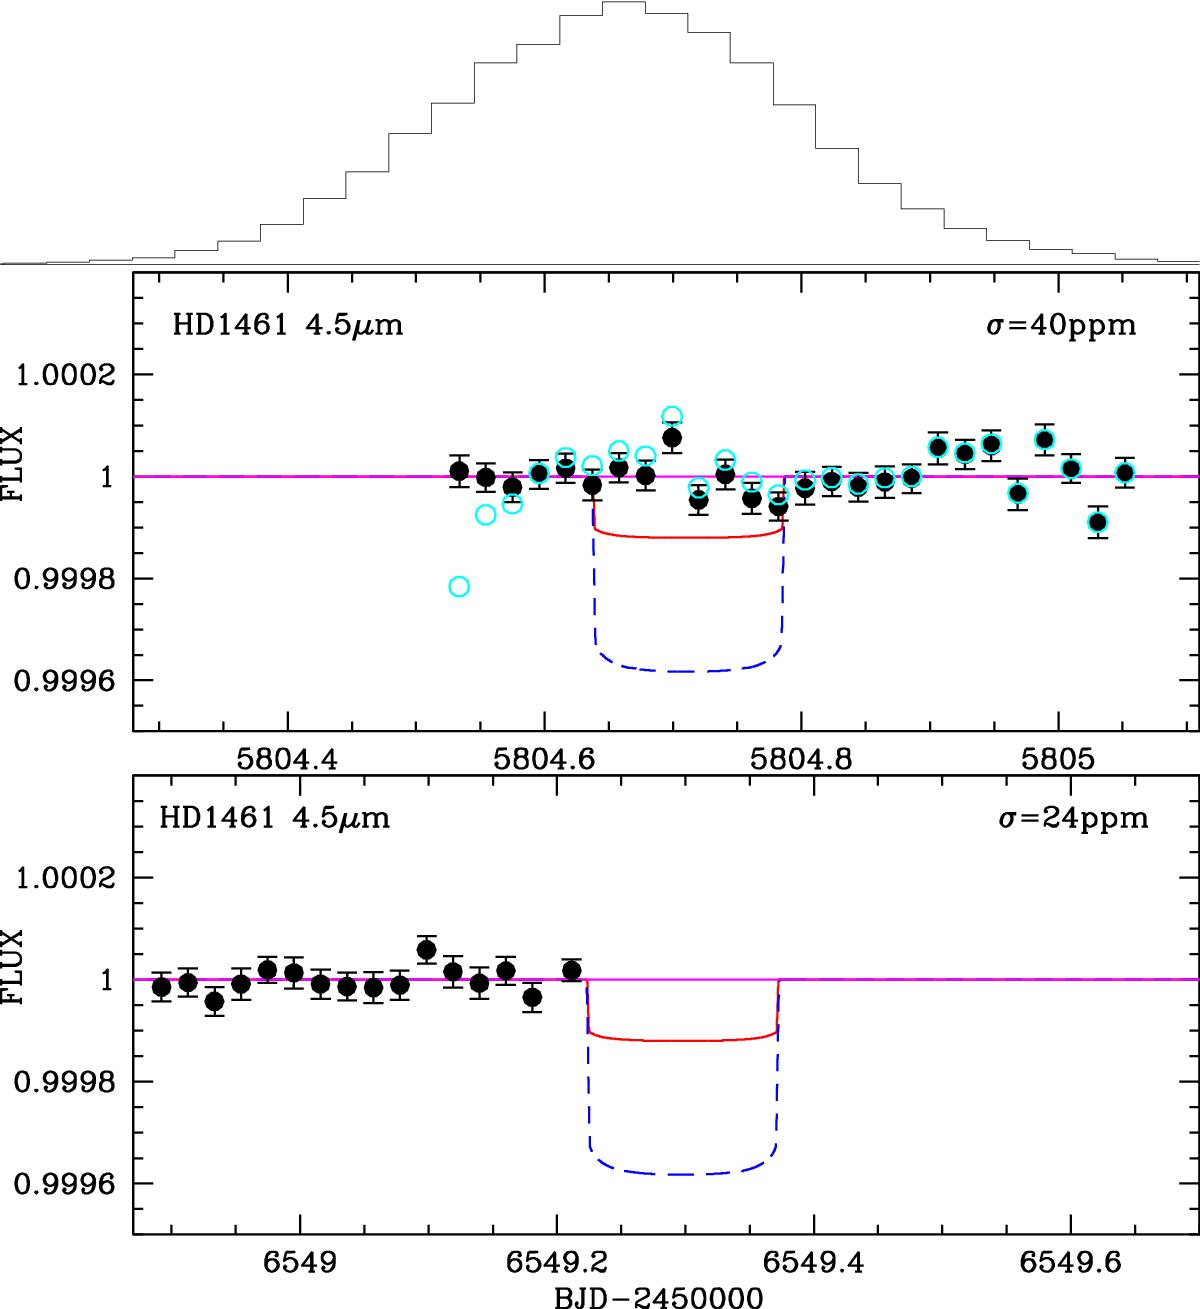
Same as Fig. 1 for HD 1461 b. Upper panel corresponds to archive data (program 80220, Kammer et al. 2014), and the lower panel corresponds to the new data gathered in our program 90072. The upper panel also shows the light curve derived without correction of the ramp effect (open pale green circles).
This figure is made of several images, please see below:
Current usage metrics show cumulative count of Article Views (full-text article views including HTML views, PDF and ePub downloads, according to the available data) and Abstracts Views on Vision4Press platform.
Data correspond to usage on the plateform after 2015. The current usage metrics is available 48-96 hours after online publication and is updated daily on week days.
Initial download of the metrics may take a while.