Fig. 15
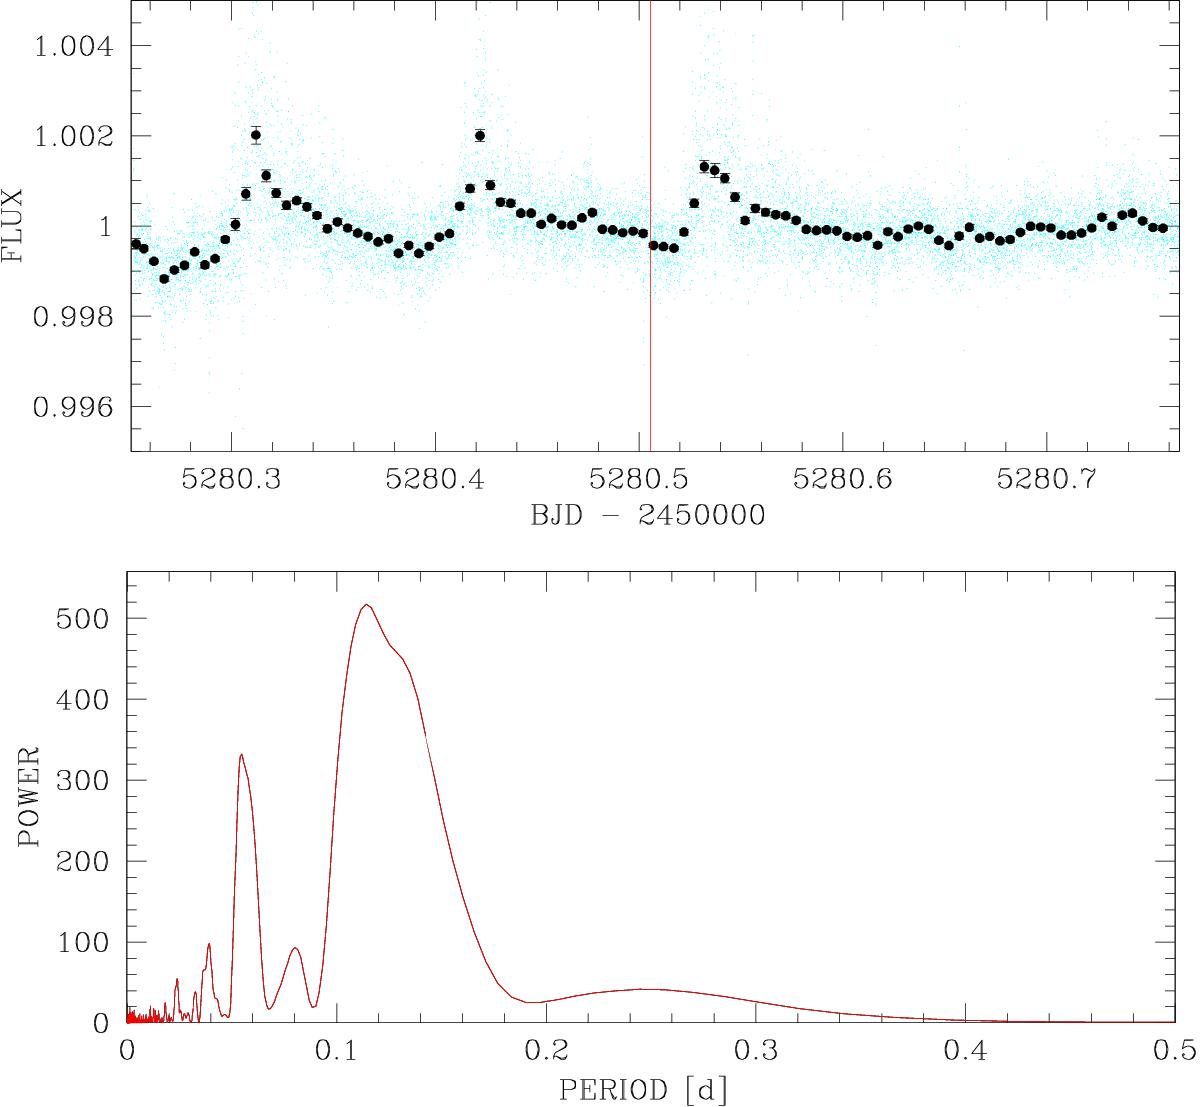
Top: 61 Vir light curve obtained by Spitzer to search for the transit of its planet b, divided for the best-fit phase-pixel model (here a third order x and y-position polynomial), unbinned (green dots) and binned to intervals of 0.005d (7.2 min). The start of the second AOR is represented by the red vertical line. Bottom: Lomb-Scargle periodogram showing a clear power excess at ~0.11 days and its first harmonic.
Current usage metrics show cumulative count of Article Views (full-text article views including HTML views, PDF and ePub downloads, according to the available data) and Abstracts Views on Vision4Press platform.
Data correspond to usage on the plateform after 2015. The current usage metrics is available 48-96 hours after online publication and is updated daily on week days.
Initial download of the metrics may take a while.