Fig. 9
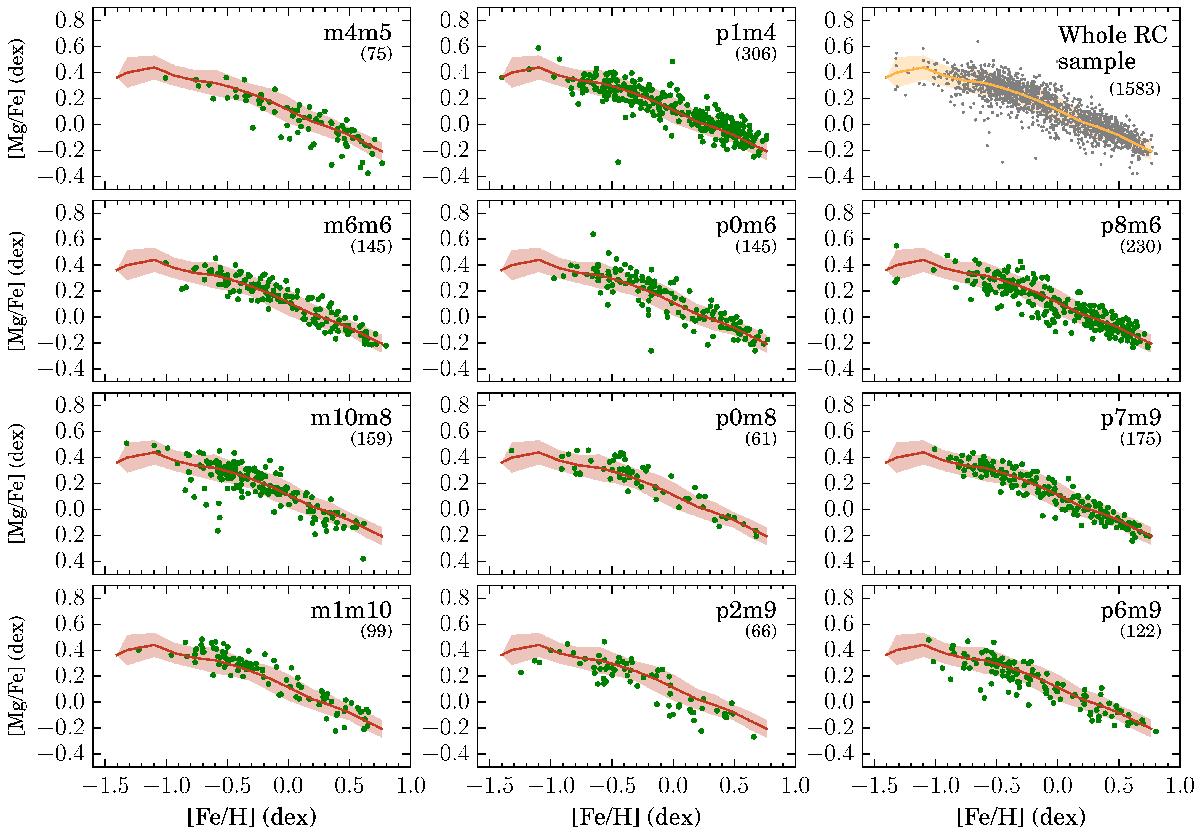
Sample distribution in the [Mg/Fe] vs. [Fe/H] plane. Upper right panel: whole working sample (gray points). A fiducial median profile and 1σ dispersion band is constructed over several metallicity bins. Remaining panels: individual field distributions (green points) and fiducial profile and dispersion band of the whole working sample (red line and shaded area). The number of stars is given in parentheses. The order of the panels approximately indicates the positions of fields in the (l,b) plane.
Current usage metrics show cumulative count of Article Views (full-text article views including HTML views, PDF and ePub downloads, according to the available data) and Abstracts Views on Vision4Press platform.
Data correspond to usage on the plateform after 2015. The current usage metrics is available 48-96 hours after online publication and is updated daily on week days.
Initial download of the metrics may take a while.