Fig. 7
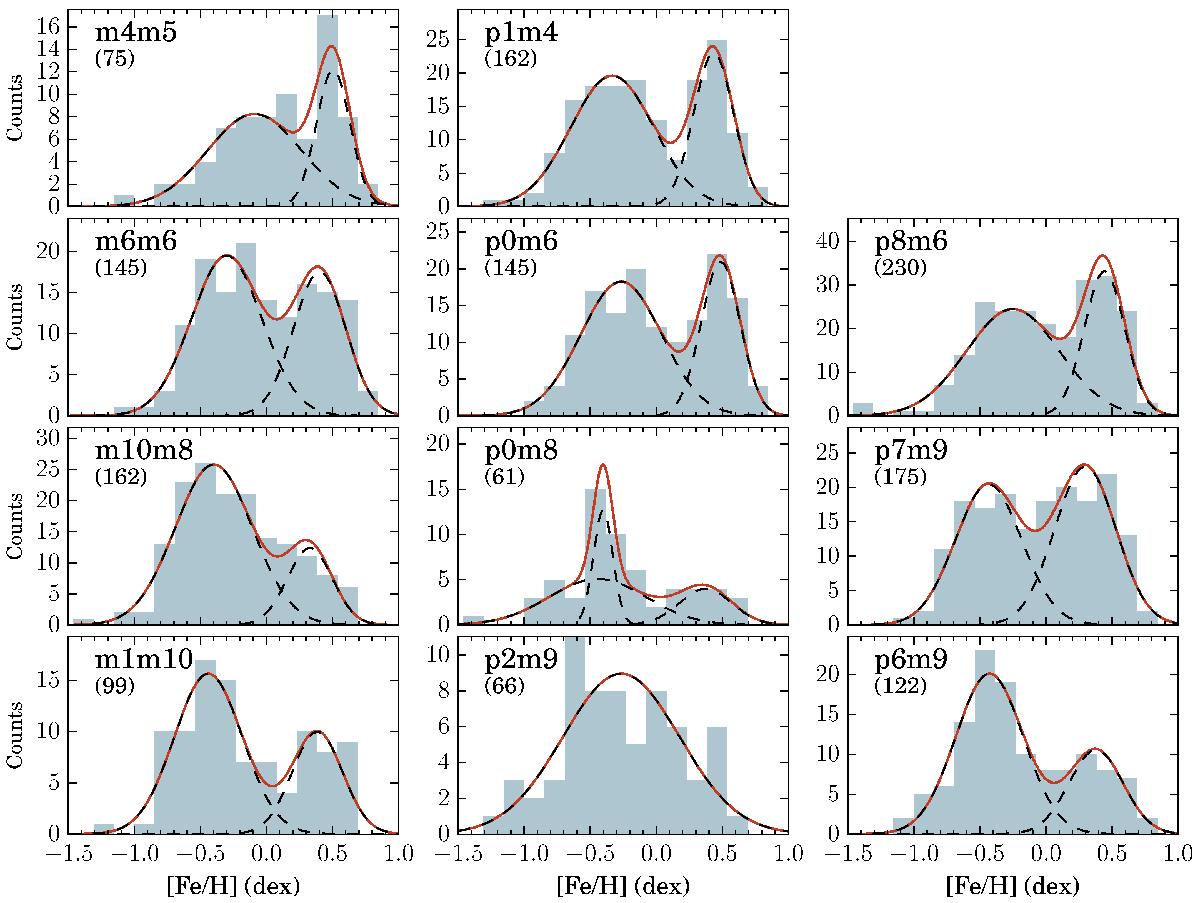
Metallicity distribution functions of the 11 bulge fields. Blue filled histograms stand for the individual distributions; the number of stars is given in parentheses. An independent GMM decomposition in each field is indicated by black dashed lines (individual modes) and a red solid line (composite profile). The distribution of the fields in the panels approximately indicates their positions in (l,b) (cf. Fig. 1).
Current usage metrics show cumulative count of Article Views (full-text article views including HTML views, PDF and ePub downloads, according to the available data) and Abstracts Views on Vision4Press platform.
Data correspond to usage on the plateform after 2015. The current usage metrics is available 48-96 hours after online publication and is updated daily on week days.
Initial download of the metrics may take a while.