Free Access
Fig. 4
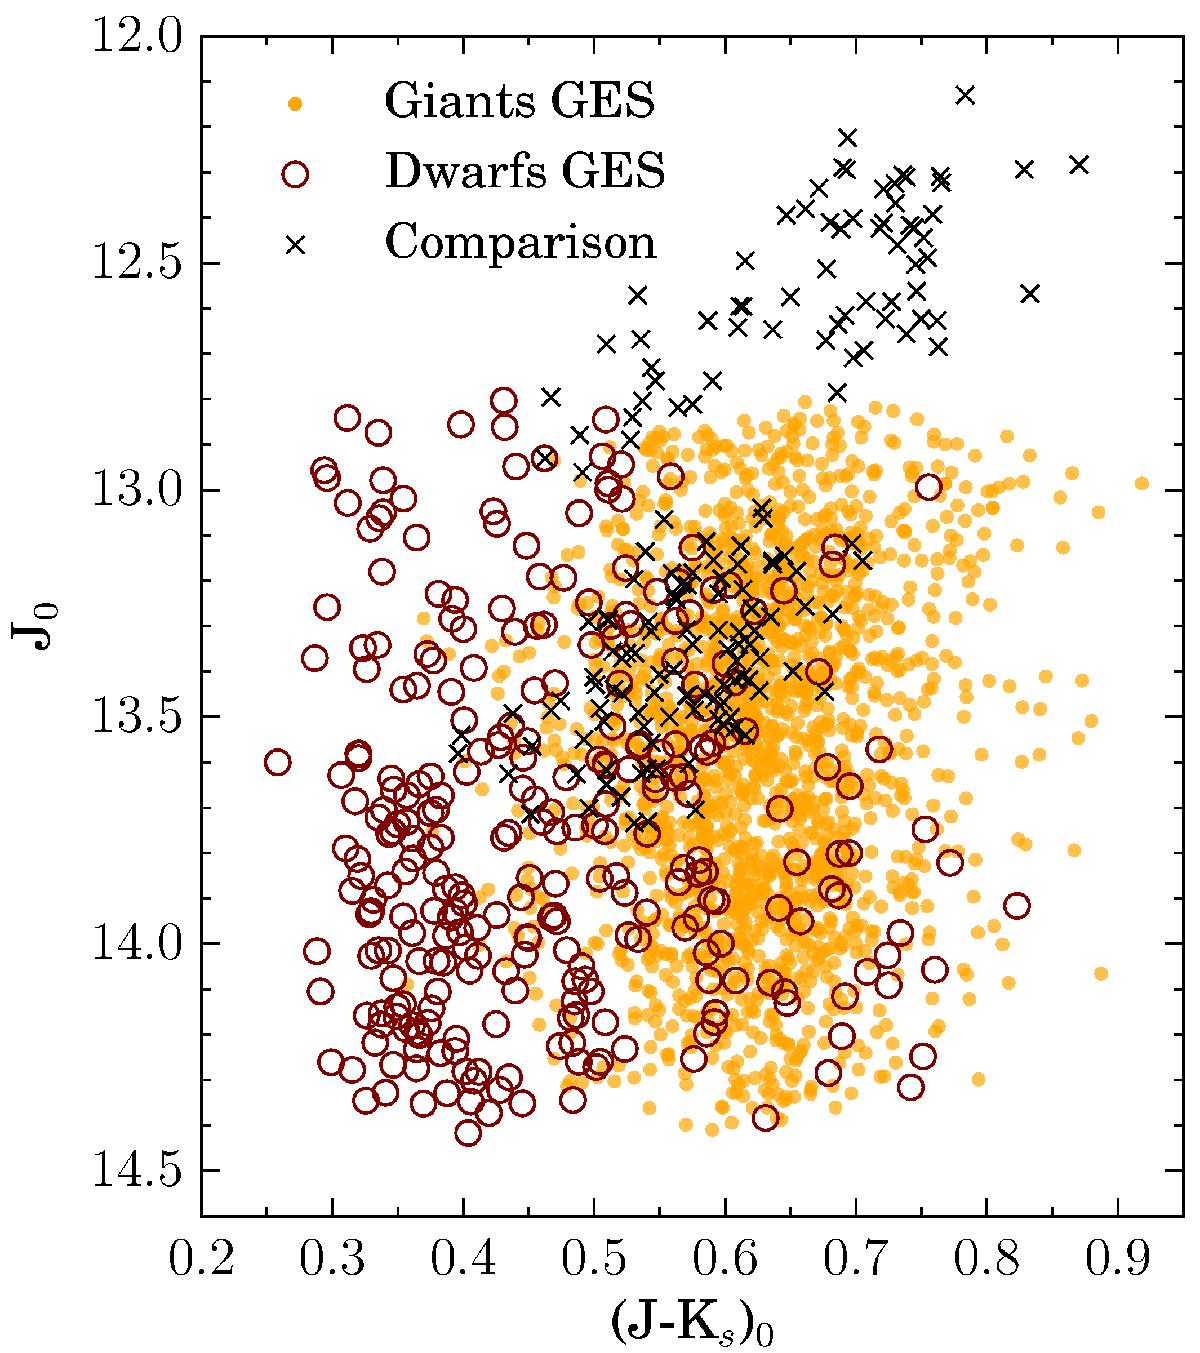
Color magnitude diagram of the whole spectroscopic sample. Stars with log (g) > 3.5 are marked as open brown circles, while those with log (g) < 3.5 as filled orange circles. The comparison sample of RC and RGB stars (all with log (g) < 3.5) are indicated by black crosses.
Current usage metrics show cumulative count of Article Views (full-text article views including HTML views, PDF and ePub downloads, according to the available data) and Abstracts Views on Vision4Press platform.
Data correspond to usage on the plateform after 2015. The current usage metrics is available 48-96 hours after online publication and is updated daily on week days.
Initial download of the metrics may take a while.