Fig. 2
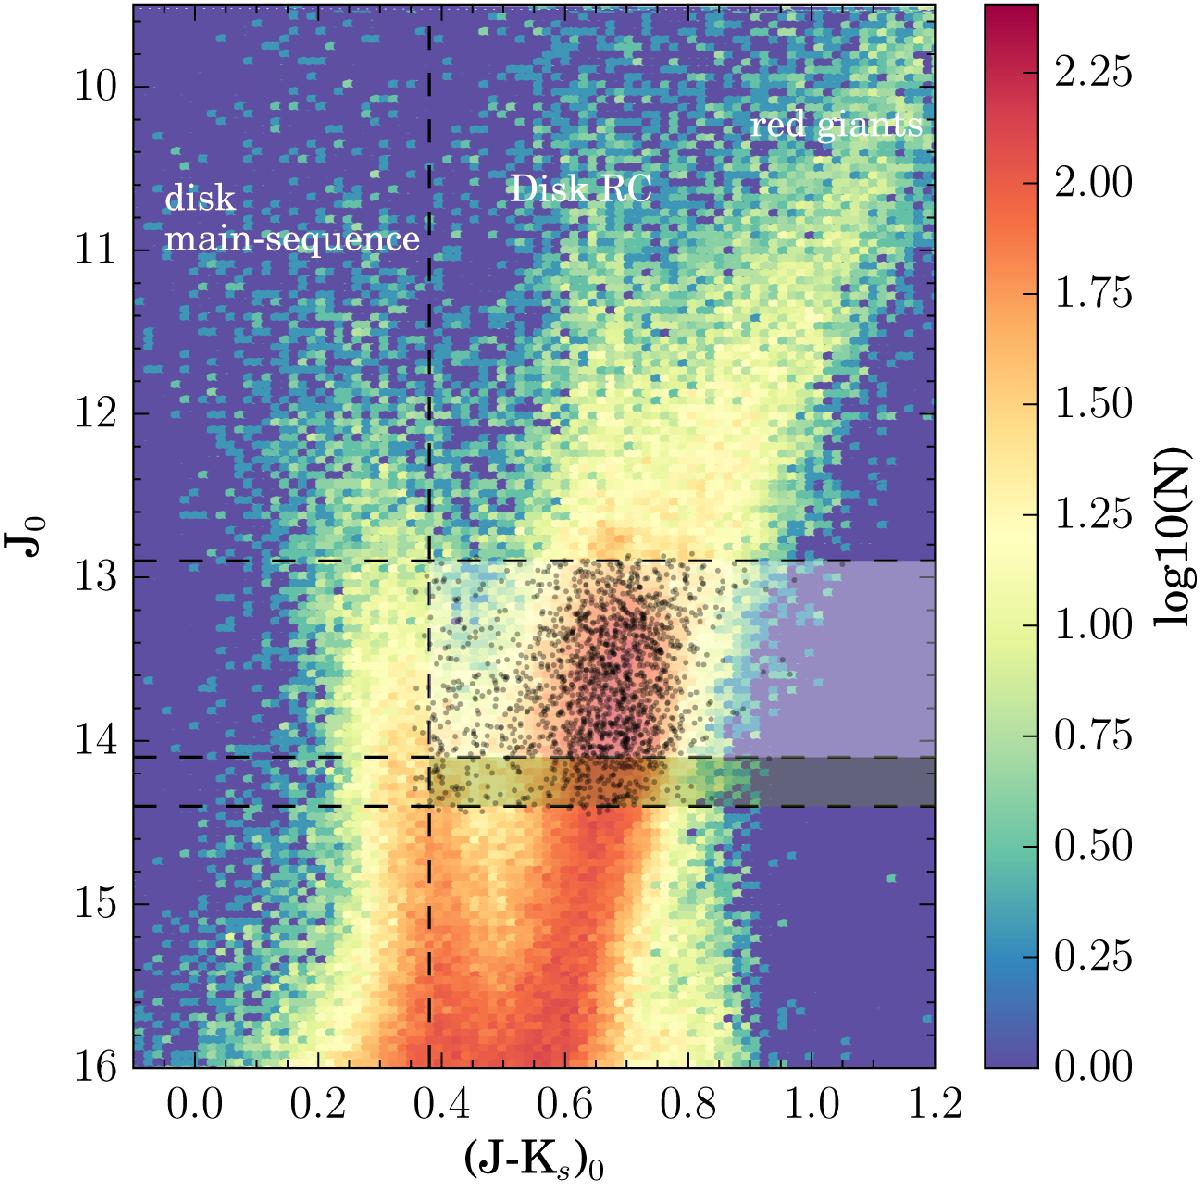
Gaia-ESO Survey bulge selection function. The background Hess diagram depicts a generic CMD in the bulge region from VVV photometry. Prominent sequences are labeled. A shaded white area indicates the main selection function, with color and magnitude cuts of (J−Ks)0 > 0.38 and 12.9 < J0 < 14.1, respectively. The green shaded area indicates the magnitude extension implemented in fields where the double red clump feature is visible. The whole spectroscopic sample analyzed in the present study is displayed with black dots.
Current usage metrics show cumulative count of Article Views (full-text article views including HTML views, PDF and ePub downloads, according to the available data) and Abstracts Views on Vision4Press platform.
Data correspond to usage on the plateform after 2015. The current usage metrics is available 48-96 hours after online publication and is updated daily on week days.
Initial download of the metrics may take a while.