Fig. 13
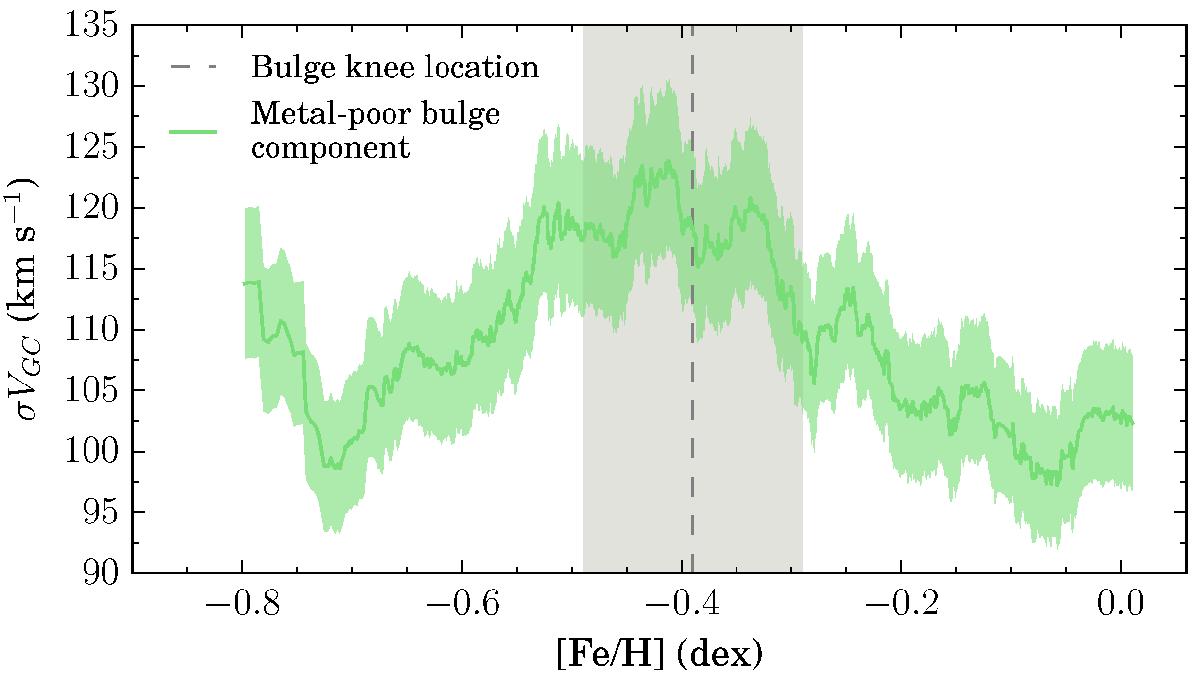
Velocity dispersion vs. metallicity profile of the metal-poor bulge. A running median with bin size of 170 data points is used to construct the curve displayed as a green solid line. A 1σ error band around the mean is given by the green shaded area. The metallicity and error of the bulge knee in the [Mg/Fe] vs. [Fe/H] plane are indicated by a vertical dashed line and gray shaded area.
Current usage metrics show cumulative count of Article Views (full-text article views including HTML views, PDF and ePub downloads, according to the available data) and Abstracts Views on Vision4Press platform.
Data correspond to usage on the plateform after 2015. The current usage metrics is available 48-96 hours after online publication and is updated daily on week days.
Initial download of the metrics may take a while.