Fig. 10
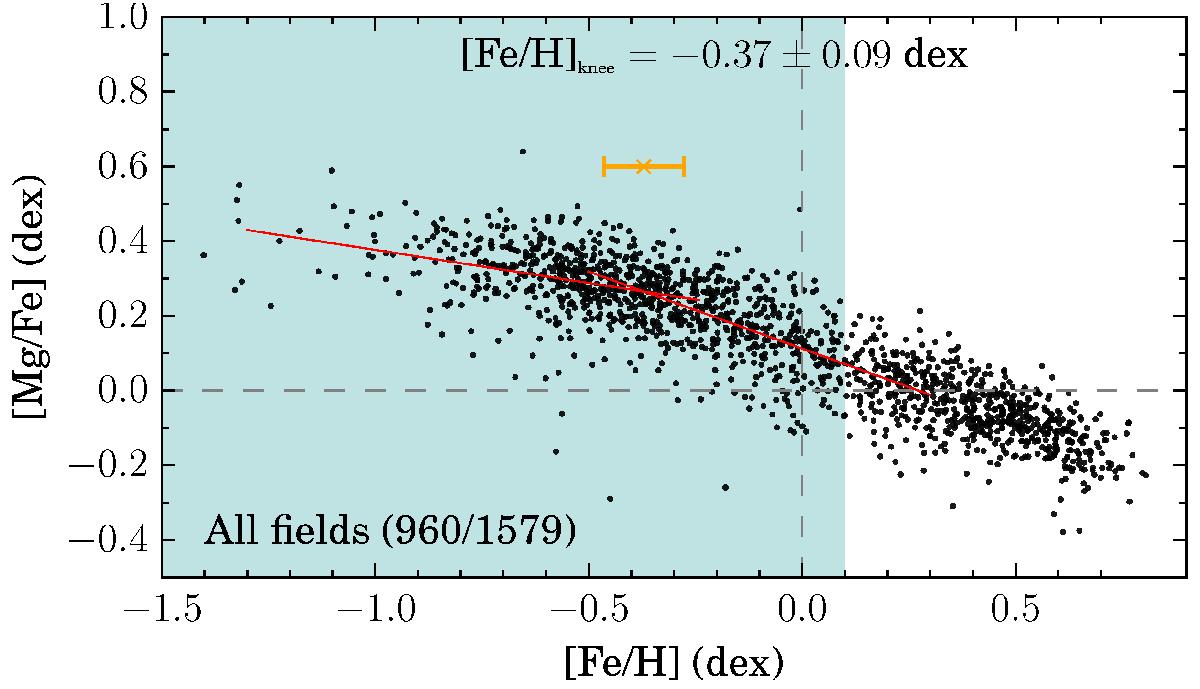
Determination of the bulge knee position in the [Mg/Fe] vs. [Fe/H] plane. The whole working sample is indicated by black dots. A bilinear model, fitted to the metal-poor bulge data (shaded blue area), is shown with red solid lines. The number of stars included in the fit, and the resulting knee position and error bar, are quoted in the figure. An orange error bar marks the knee position and error.
Current usage metrics show cumulative count of Article Views (full-text article views including HTML views, PDF and ePub downloads, according to the available data) and Abstracts Views on Vision4Press platform.
Data correspond to usage on the plateform after 2015. The current usage metrics is available 48-96 hours after online publication and is updated daily on week days.
Initial download of the metrics may take a while.