Fig. 1
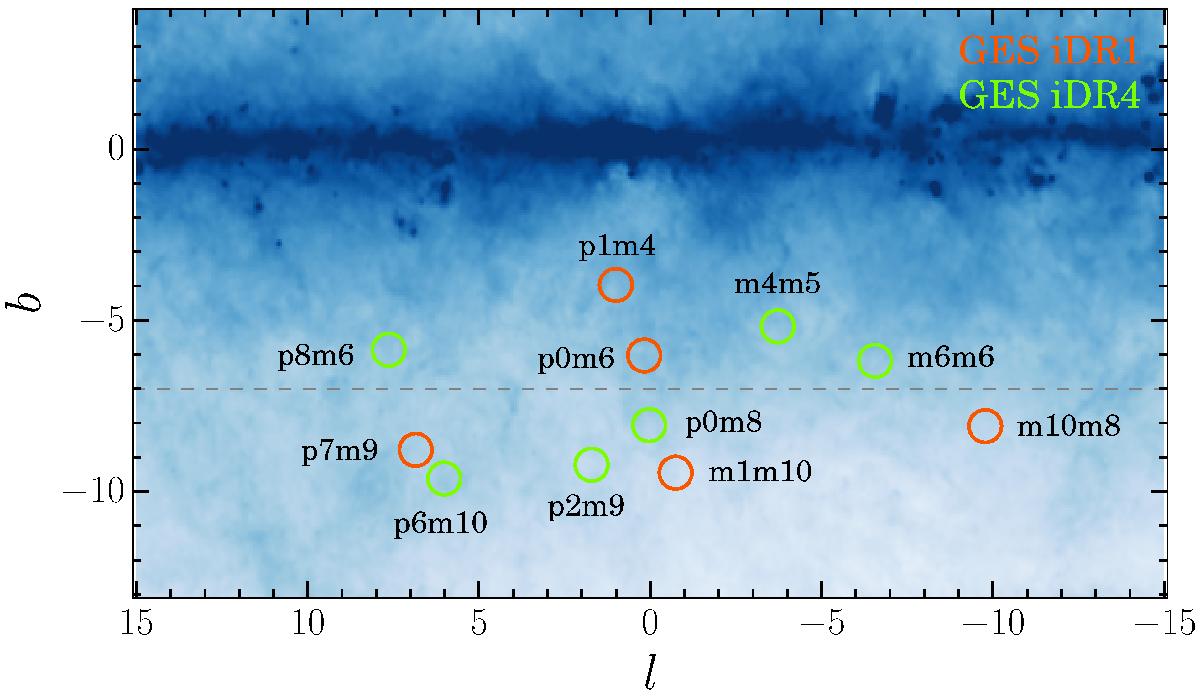
Position of the 11 bulge fields analyzed in the present study. The five red circles indicate the fields already examined in Rojas-Arriagada et al. (2014; Gaia-ESO survey iDR1), while the six green circles show the extra fields observed up to the iDR4. Each field is labeled according to the name coding adopted throughout the paper and based on the Galactic coordinates. The background image corresponds to an extinction map of the bulge region according to the Schlegel et al. (1998) prescription. The blue color density code saturates close to the plane where the extinction is high. A horizontal dashed gray line indicates b = −7°, used to divide the sample into fields close to and far from the plane.
Current usage metrics show cumulative count of Article Views (full-text article views including HTML views, PDF and ePub downloads, according to the available data) and Abstracts Views on Vision4Press platform.
Data correspond to usage on the plateform after 2015. The current usage metrics is available 48-96 hours after online publication and is updated daily on week days.
Initial download of the metrics may take a while.