Free Access
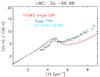
Fig. 10
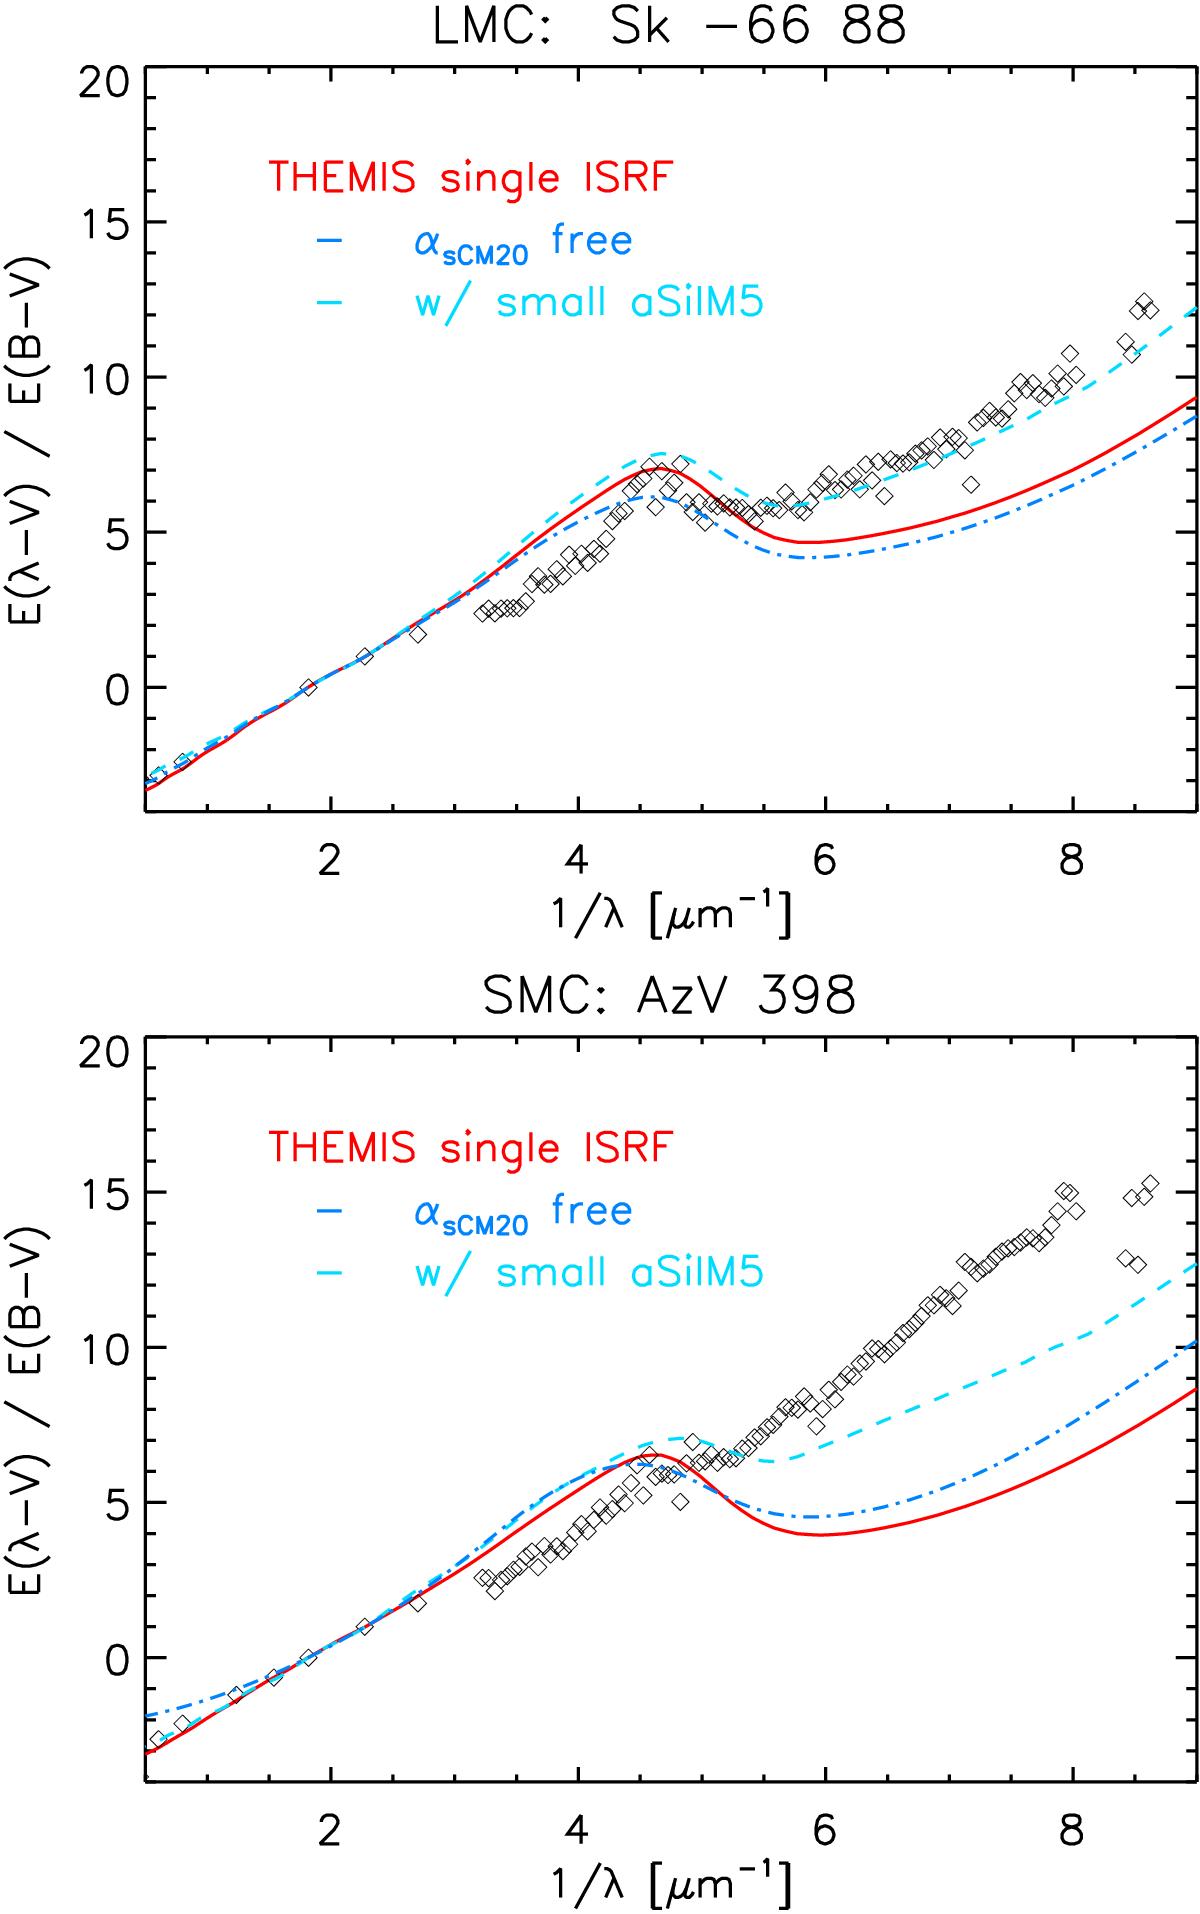
Observed extinction curves (black diamonds) in the LMC (top: Sk −68 129) and the SMC (bottom: AzV 398). We overplot the dust extinction derived from IR-emission fitting for a single-ISRF (red line) and a αsCM20 free model (light blue-dash-dot line), and with smaller silicate grains (cyan-dashed line, see Sect. 6.3.2).
This figure is made of several images, please see below:
Current usage metrics show cumulative count of Article Views (full-text article views including HTML views, PDF and ePub downloads, according to the available data) and Abstracts Views on Vision4Press platform.
Data correspond to usage on the plateform after 2015. The current usage metrics is available 48-96 hours after online publication and is updated daily on week days.
Initial download of the metrics may take a while.