Fig. 8
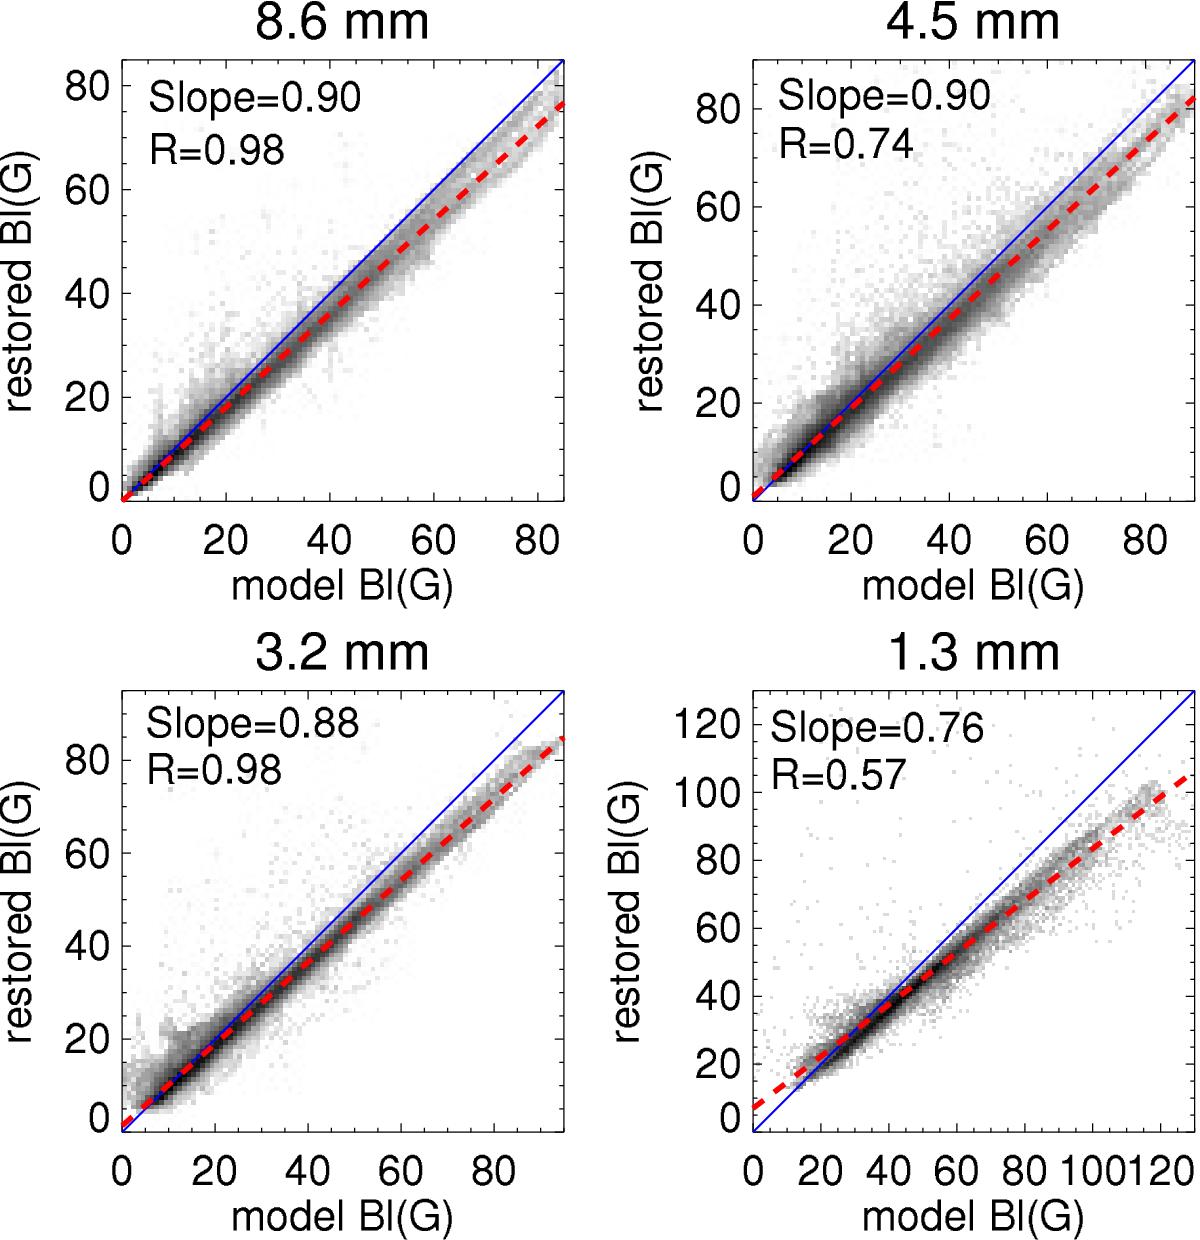
Density scatter plots (2D histograms) of restored longitudinal magnetic field ![]() vs. model longitudinal magnetic field
vs. model longitudinal magnetic field ![]() taken at the effective formation heights for the wavelengths 8.6, 4.5, 3.2, and 1.3 mm. The wavelength is indicated at the top of each panel. Darker shading indicates a higher density of pixels in the bin. Solid lines denote the expectation value,
taken at the effective formation heights for the wavelengths 8.6, 4.5, 3.2, and 1.3 mm. The wavelength is indicated at the top of each panel. Darker shading indicates a higher density of pixels in the bin. Solid lines denote the expectation value, ![]() . Dashed lines depict the linear regressions with the slopes and the Pearson correlation coefficients given in the upper left corner of each frame.
. Dashed lines depict the linear regressions with the slopes and the Pearson correlation coefficients given in the upper left corner of each frame.
Current usage metrics show cumulative count of Article Views (full-text article views including HTML views, PDF and ePub downloads, according to the available data) and Abstracts Views on Vision4Press platform.
Data correspond to usage on the plateform after 2015. The current usage metrics is available 48-96 hours after online publication and is updated daily on week days.
Initial download of the metrics may take a while.