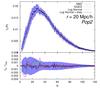
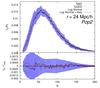
Fig. 3
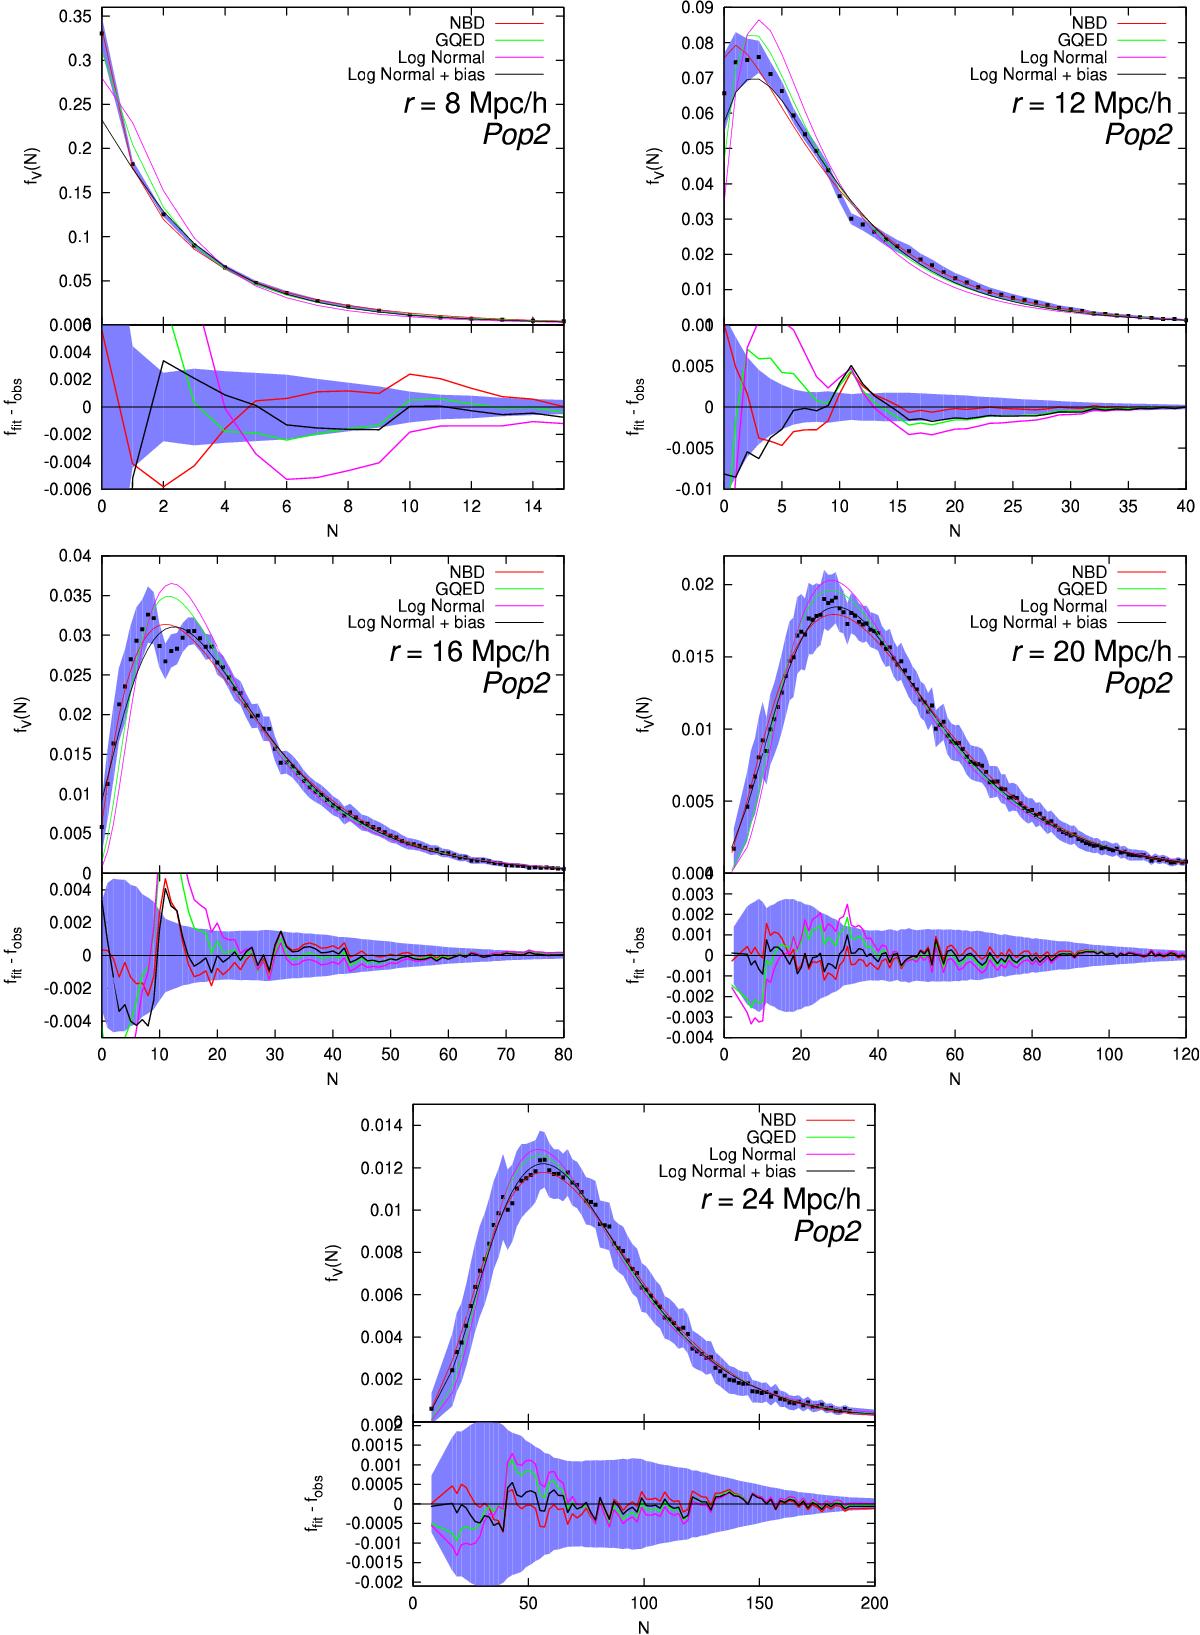
Count-in-cells results for Population 2. fV(N) CiC distribution function with best fit models and error bars. Top to bottom and left to right: radii 8, 12, 16, 20 and 24 h-1 Mpc. Best fit plots for bins with Gaussian errors. Boxes: NBD residuals, GQED residuals, log normal distribution residuals, log normal with bias distribution residuals.
Current usage metrics show cumulative count of Article Views (full-text article views including HTML views, PDF and ePub downloads, according to the available data) and Abstracts Views on Vision4Press platform.
Data correspond to usage on the plateform after 2015. The current usage metrics is available 48-96 hours after online publication and is updated daily on week days.
Initial download of the metrics may take a while.