Fig. 1
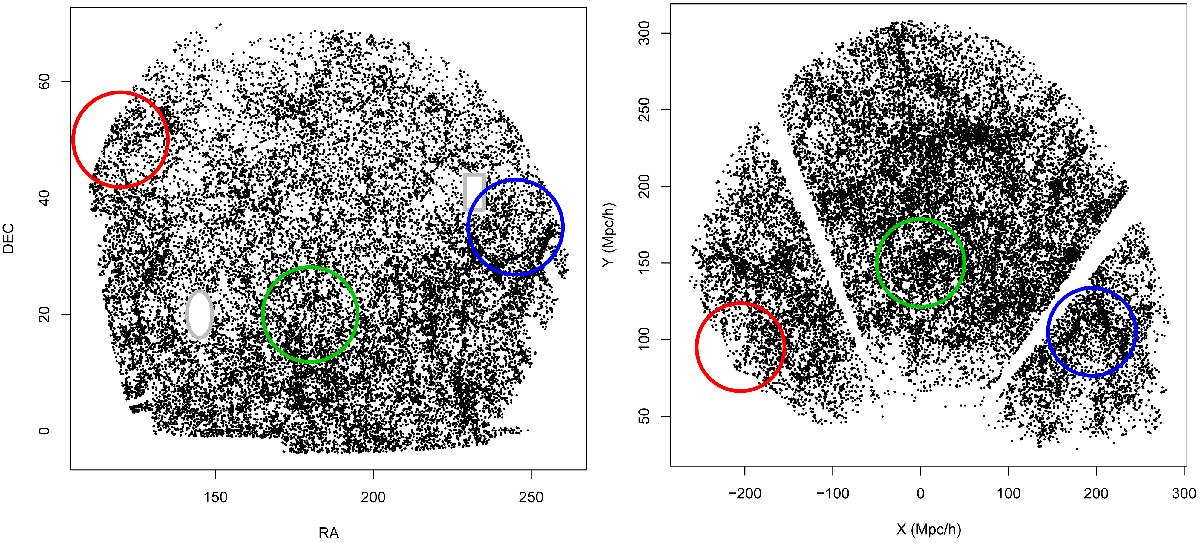
Illustration of the calculation of the counts-in-cells. On the left panel, we show the footprint of about 10% of the galaxies in the SDSS survey used here (Population 1) in right ascension and declination. We see the irregular sky coverage in the borders outlined by the points. In addition, two masked regions have been added to illustrate the real mask. These masked regions are also illustrated on the right panel where we represent an edge-diagram in Cartesian comoving coordinates. In both panels, the green circle represents a cell which falls completely within the surveyed region, the blue circle represent a cell, still accepted for the counts-in-cells algorithm, that has part of its volume outside of the window, but at least 95% of it within the surveyed regions. In this case, counts are compensated to account for the galaxies unseen by the masked regions. Finally, the red circle represents a rejected cell because more than 5% of its volume falls out of the surveyed region.
Current usage metrics show cumulative count of Article Views (full-text article views including HTML views, PDF and ePub downloads, according to the available data) and Abstracts Views on Vision4Press platform.
Data correspond to usage on the plateform after 2015. The current usage metrics is available 48-96 hours after online publication and is updated daily on week days.
Initial download of the metrics may take a while.