Fig. 8
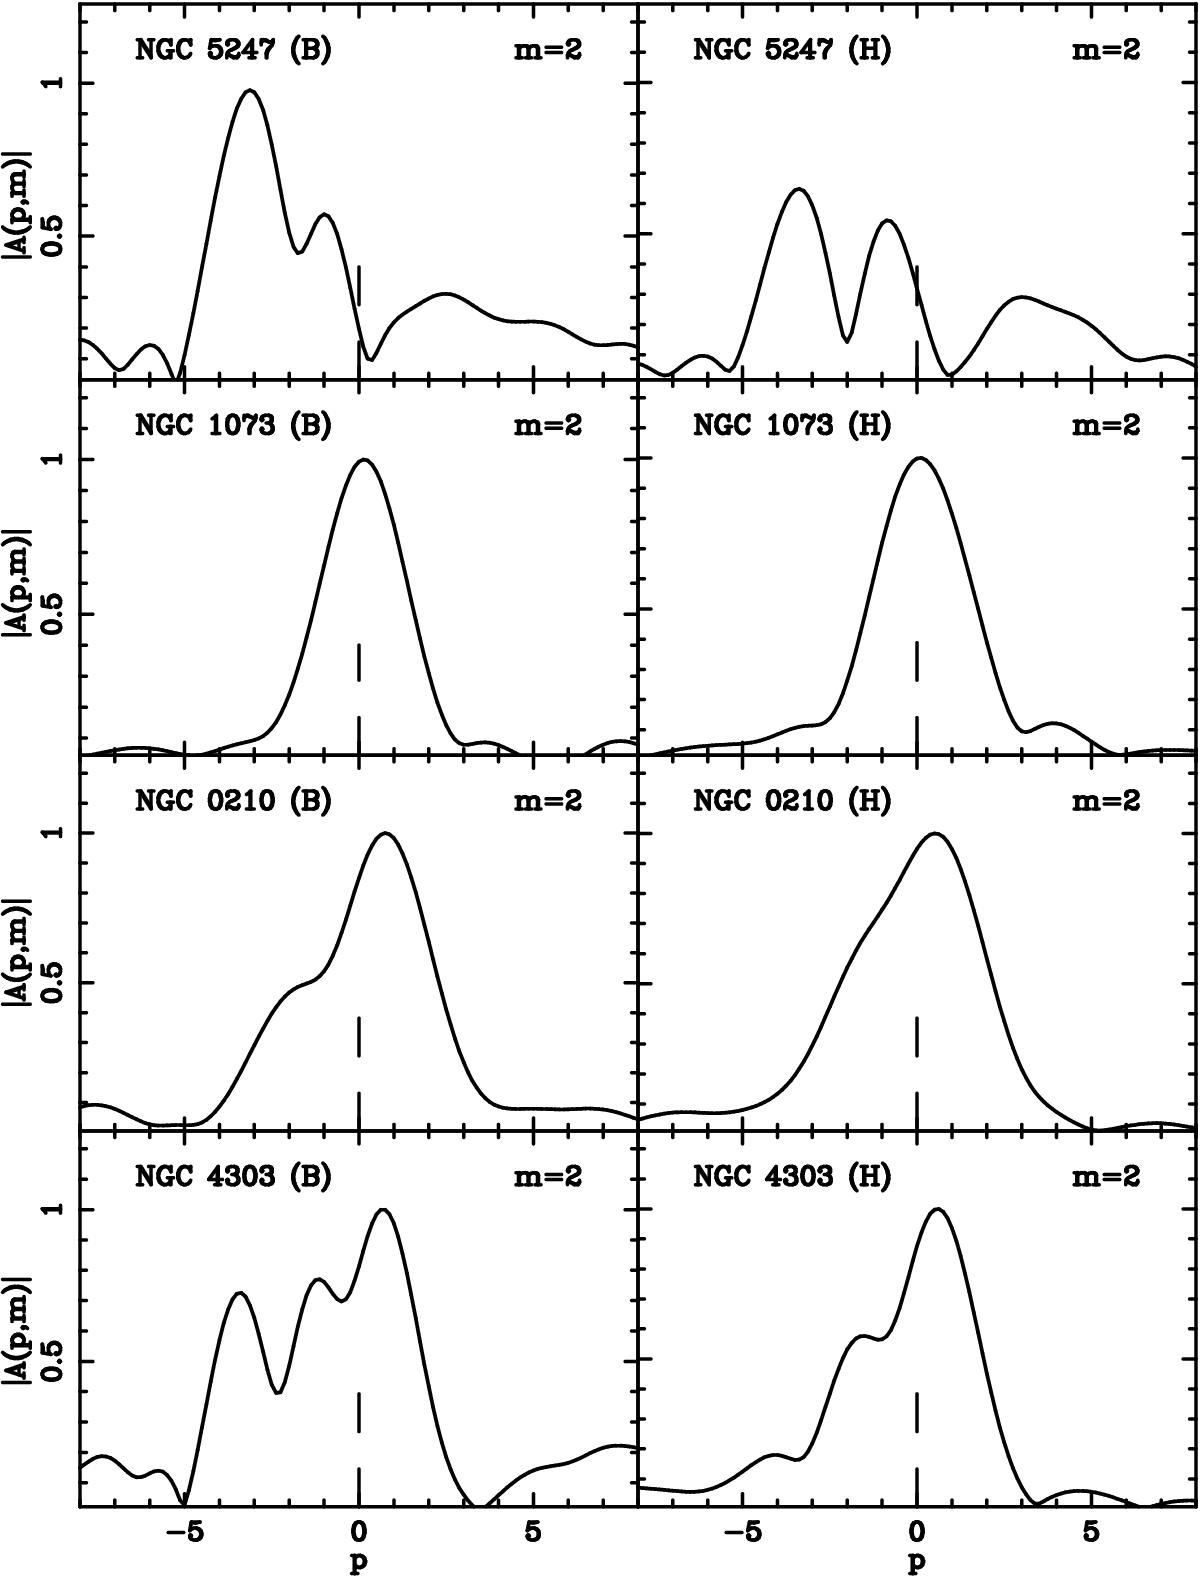
Spectra from the B and H band images of the four galaxies shown in Figs. 6 and 7. From top to bottom, NGC 5247, NGC 1073, NGC 210, and NGC 4303 are shown. We can compare the results for the m = 2 components in both passbands. In the left panels we have the spectra for the B passband, while in the right panels the m = 2 spectrum for each galaxy in the H passband. A dashed vertical line shows the location of p = 0.
Current usage metrics show cumulative count of Article Views (full-text article views including HTML views, PDF and ePub downloads, according to the available data) and Abstracts Views on Vision4Press platform.
Data correspond to usage on the plateform after 2015. The current usage metrics is available 48-96 hours after online publication and is updated daily on week days.
Initial download of the metrics may take a while.