Fig. 4
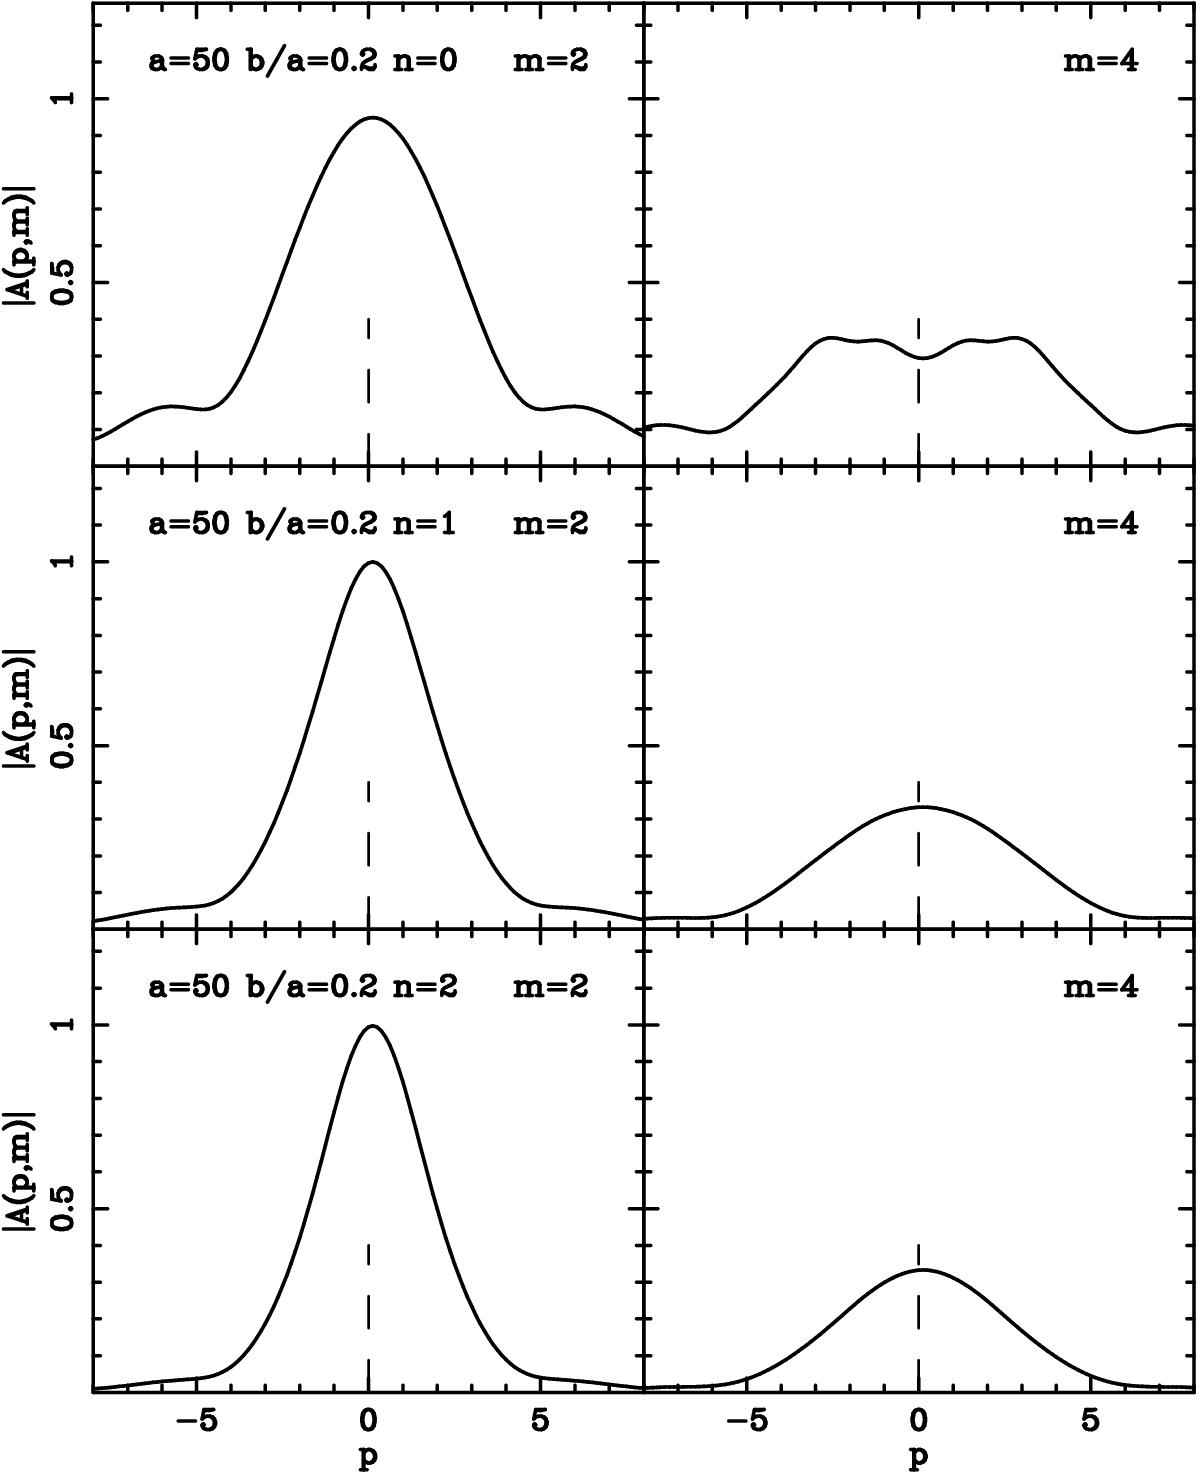
Spectra from the idealised barred galaxy images with different concentration indexes and an axis ratio of 0.2. The results for the m = 2 components are given in the left-hand panels and for the m = 4 in the right-hand panels. A dashed vertical line is placed at p = 0. The numerical values of a, b, and n are given in the upper left corner of the left panels. The three signals are normalised to the maximum of the three values.
Current usage metrics show cumulative count of Article Views (full-text article views including HTML views, PDF and ePub downloads, according to the available data) and Abstracts Views on Vision4Press platform.
Data correspond to usage on the plateform after 2015. The current usage metrics is available 48-96 hours after online publication and is updated daily on week days.
Initial download of the metrics may take a while.