Fig. 2
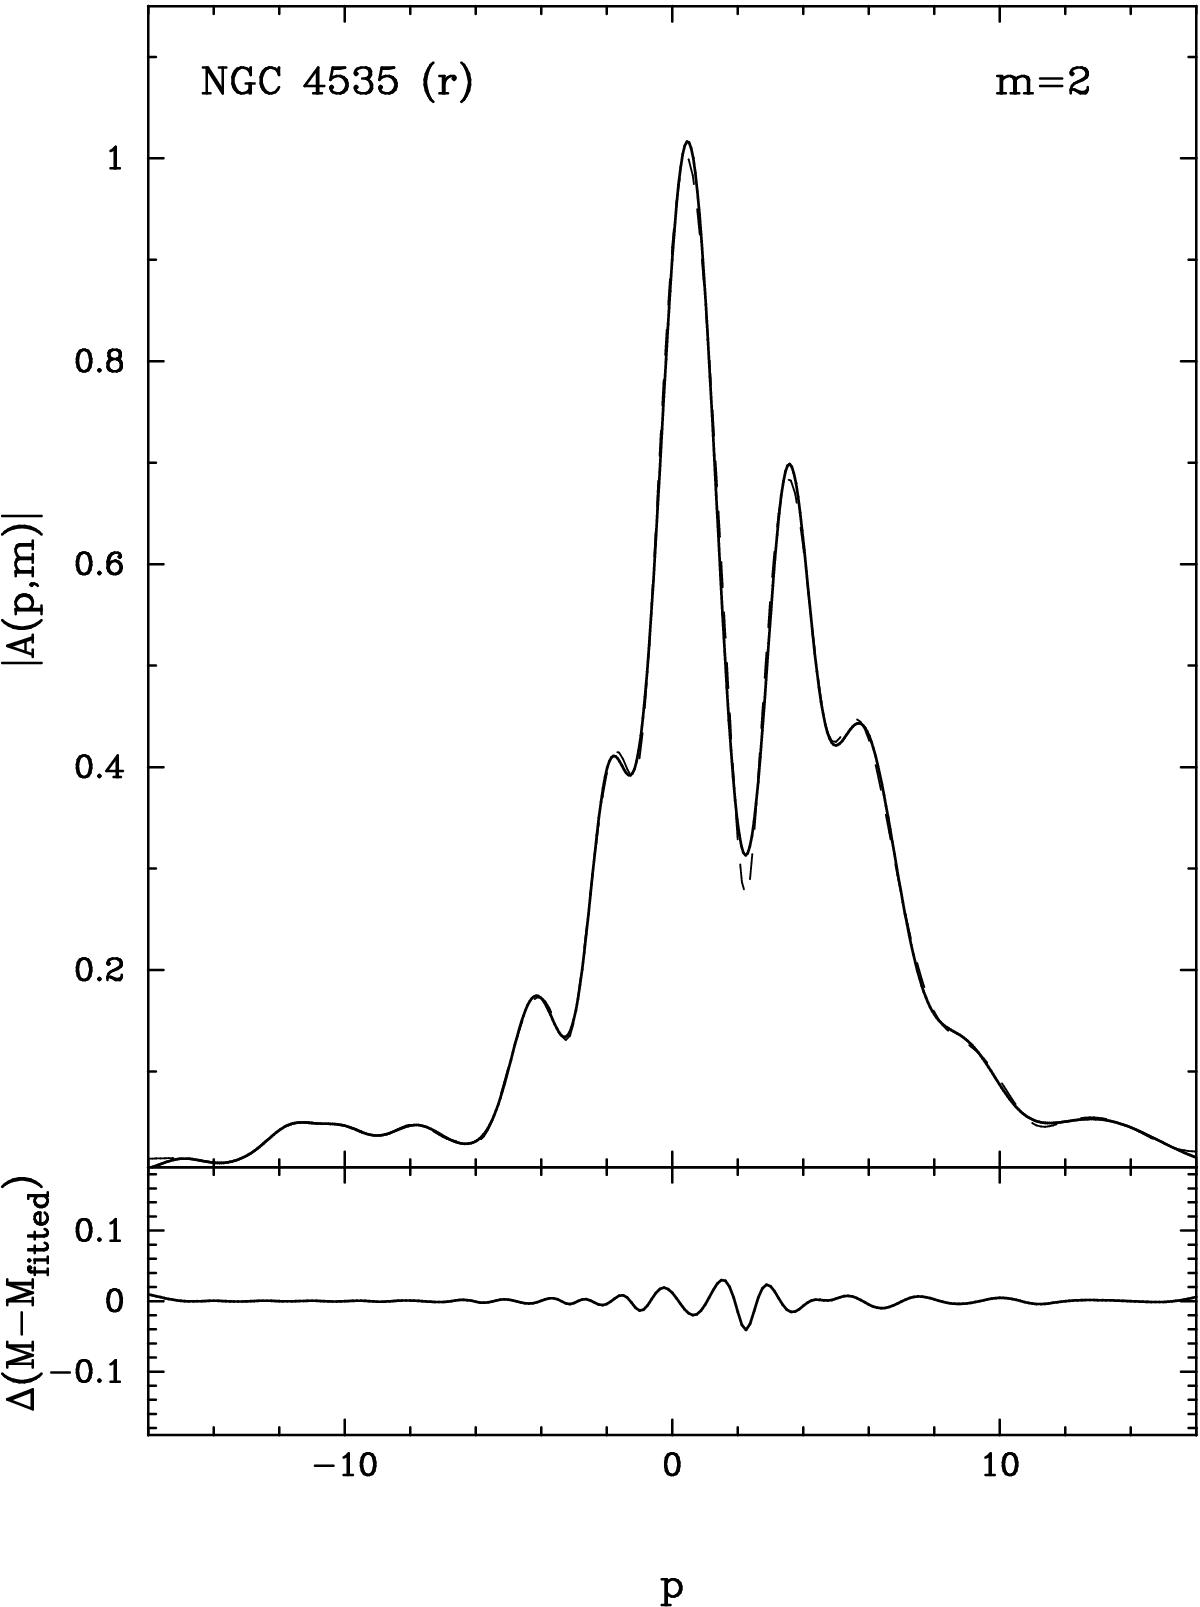
Upper panel: modulus of the m = 2 Fourier spectrum obtained from an r band image of the galaxy NGC 4535. This modulus has considerable substructure, due to the presence of many components. We superimpose using a dotted line the Gaussian fit, obtained as described in the text. Lower panel: difference between the value of the m = 2 modulus and the Gaussian fit. This fit, whose quality is typical for our sample, reproduces very well the m = 2 modulus, in spite of the latter’s complexity.
Current usage metrics show cumulative count of Article Views (full-text article views including HTML views, PDF and ePub downloads, according to the available data) and Abstracts Views on Vision4Press platform.
Data correspond to usage on the plateform after 2015. The current usage metrics is available 48-96 hours after online publication and is updated daily on week days.
Initial download of the metrics may take a while.