Fig. 13
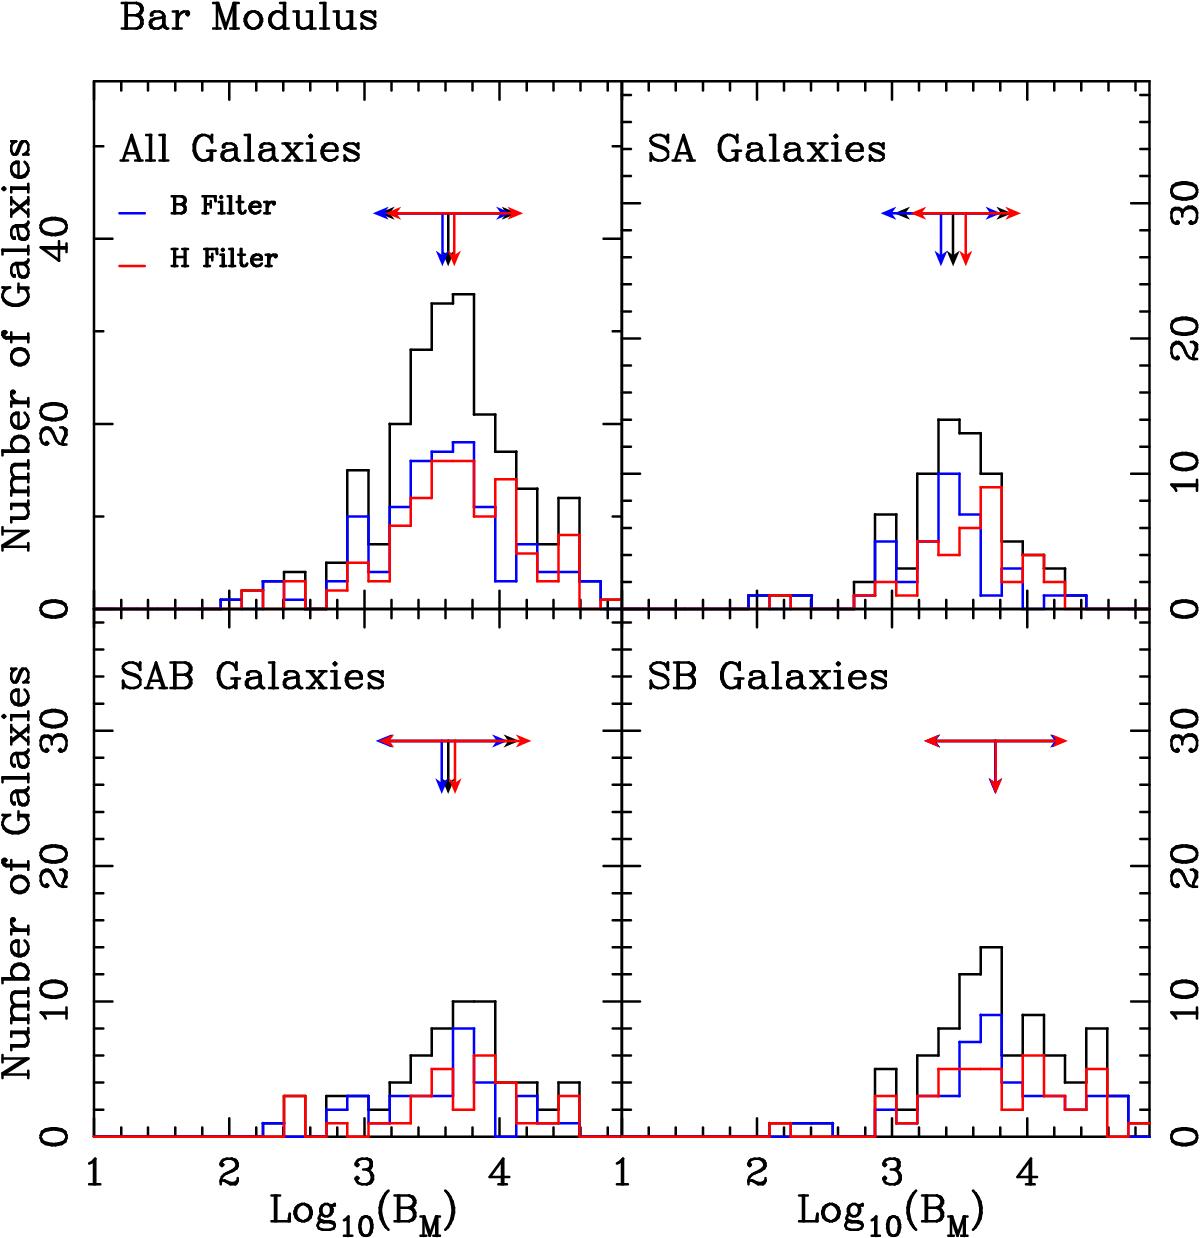
Number of galaxies as a function of their bar modulus in the OSU sample. The upper left panel includes all galaxies, while the three others include only the SA, SAB, and SB families. In each panel the solid line corresponds to the values obtained for all the images irrespective of the filter used. We also separate the values for the galaxies studied using the B filter (blue) and H filter (red). The scales for the ordinate are not the same for all panels. The vertical arrows indicate the mean value for each population, while the length of the horizontal arrows indicate the value of the sigma of the distribution.
Current usage metrics show cumulative count of Article Views (full-text article views including HTML views, PDF and ePub downloads, according to the available data) and Abstracts Views on Vision4Press platform.
Data correspond to usage on the plateform after 2015. The current usage metrics is available 48-96 hours after online publication and is updated daily on week days.
Initial download of the metrics may take a while.