Free Access
Fig. 12
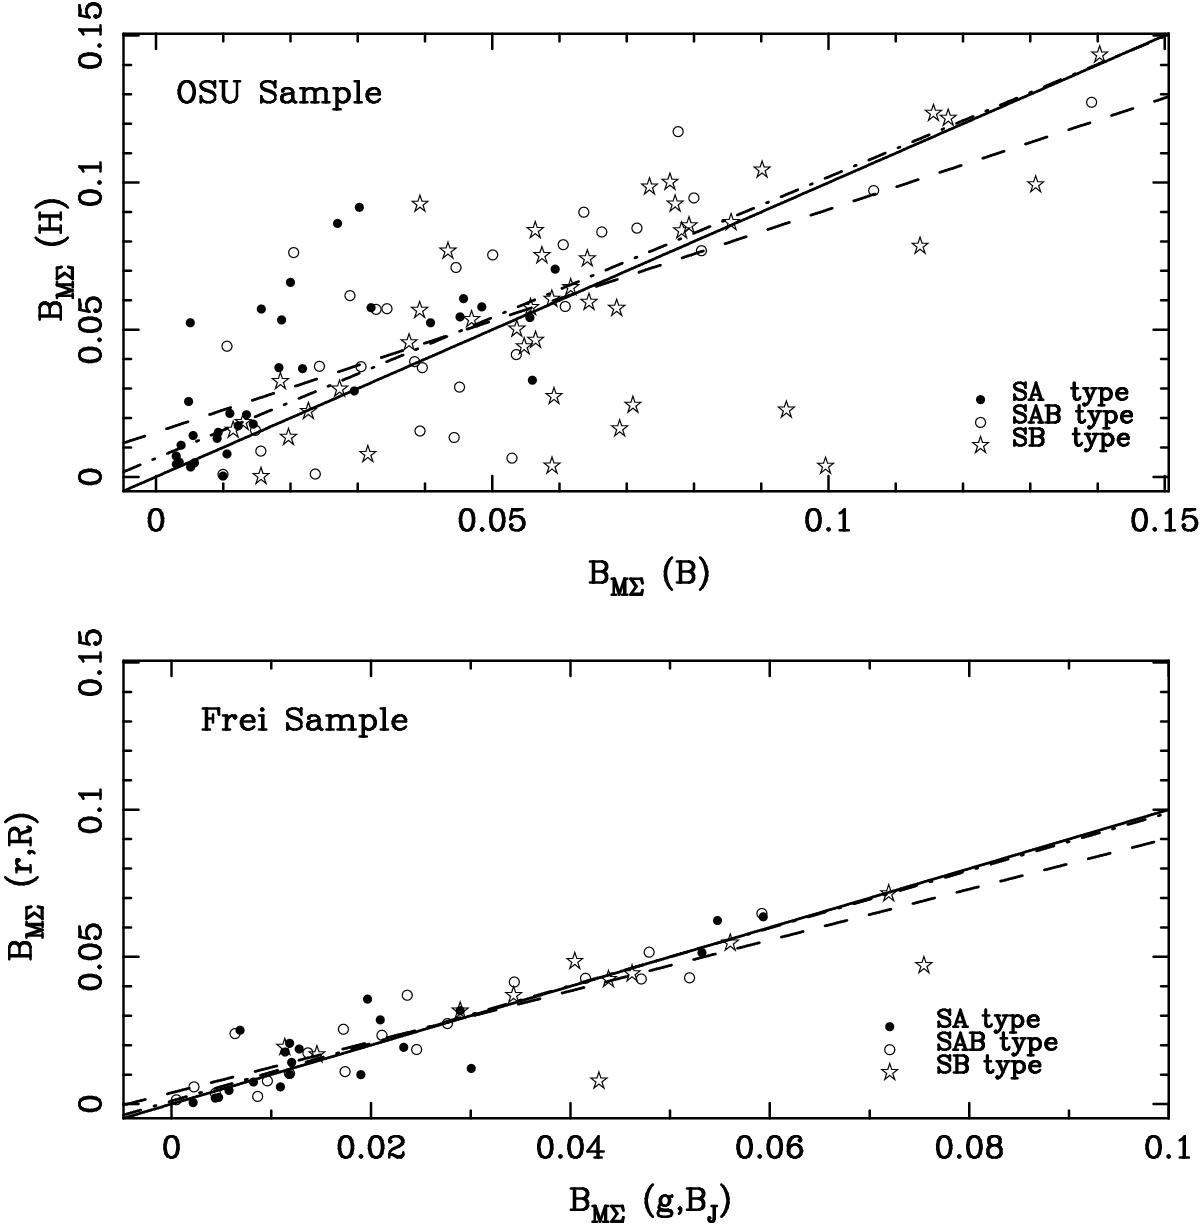
Correlation of the values of the BM ∑ parameter for the blue and red passbands for the two samples. The layout is as in Fig. 10, but here we only show the standard linear regression line (dash-dotted line) and the robust optimal M-regression line (dashed line).
Current usage metrics show cumulative count of Article Views (full-text article views including HTML views, PDF and ePub downloads, according to the available data) and Abstracts Views on Vision4Press platform.
Data correspond to usage on the plateform after 2015. The current usage metrics is available 48-96 hours after online publication and is updated daily on week days.
Initial download of the metrics may take a while.