Fig. 10
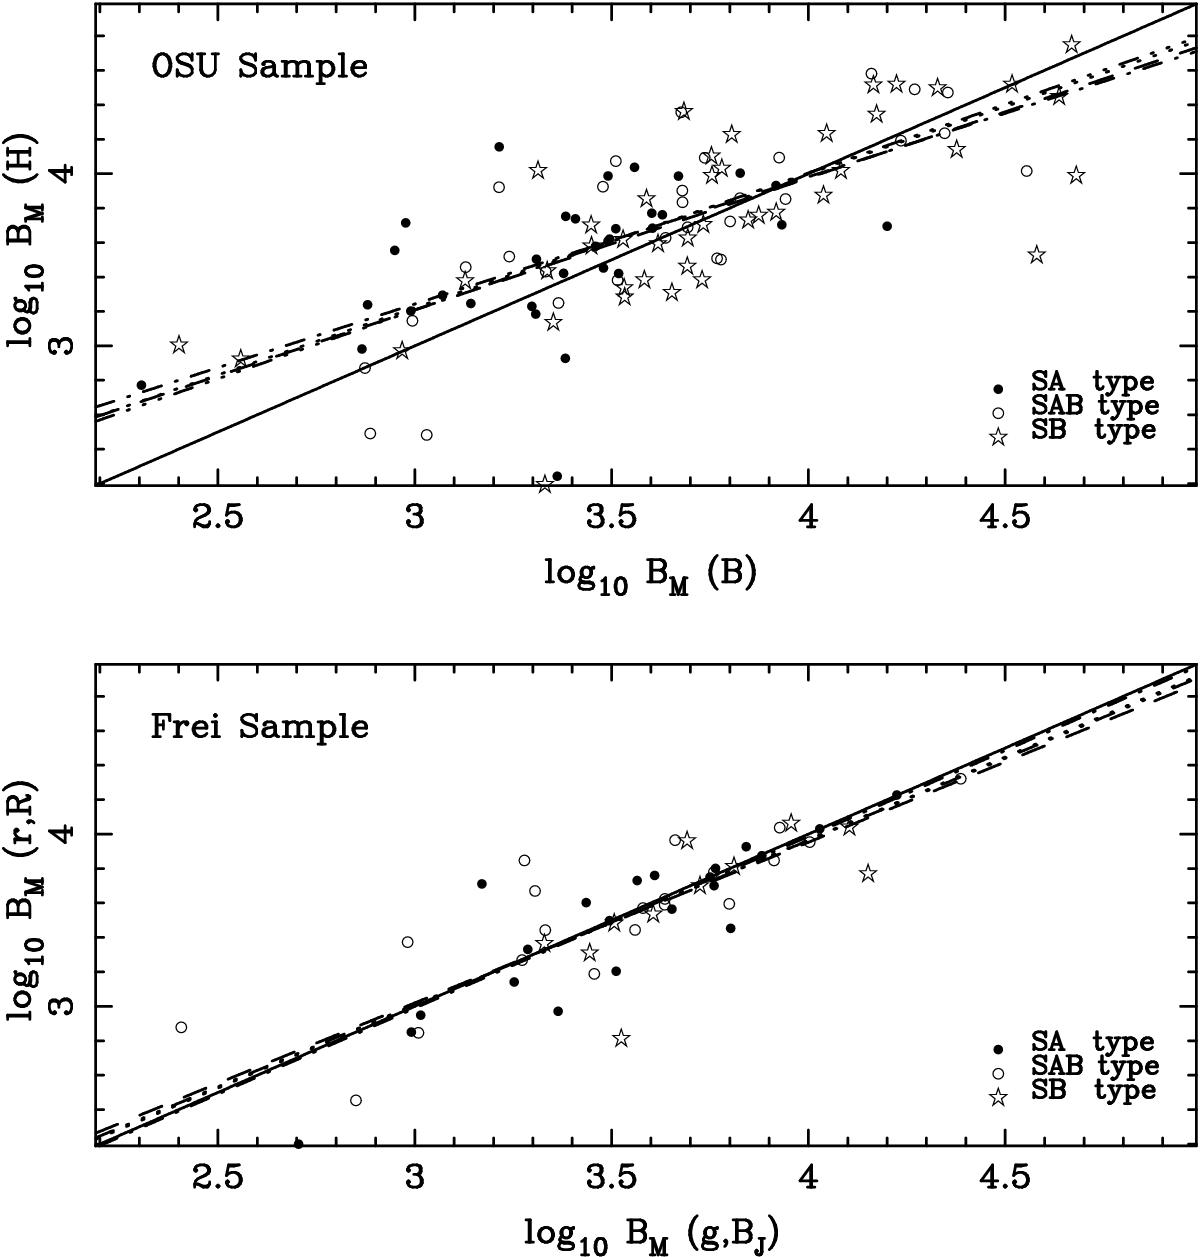
Correlation between the values of the log 10BM parameter for the blue and red filters. The bold line is the diagonal, while the dashed line is the standard least squares bisector line. The dot-dashed, dotted, and dot-dot-dot-dashed line correspond to the robust optimal M-regression line, the robust mean biponderate regression line, and the robust winsorised regression line, respectively. The SA galaxies are represented as filled circles, the SAB galaxies as open circles, and the SB galaxies as open stars. The upper panel gives results for the OSU sample and the lower panel for the Frei sample.
Current usage metrics show cumulative count of Article Views (full-text article views including HTML views, PDF and ePub downloads, according to the available data) and Abstracts Views on Vision4Press platform.
Data correspond to usage on the plateform after 2015. The current usage metrics is available 48-96 hours after online publication and is updated daily on week days.
Initial download of the metrics may take a while.