Free Access
Fig. 1
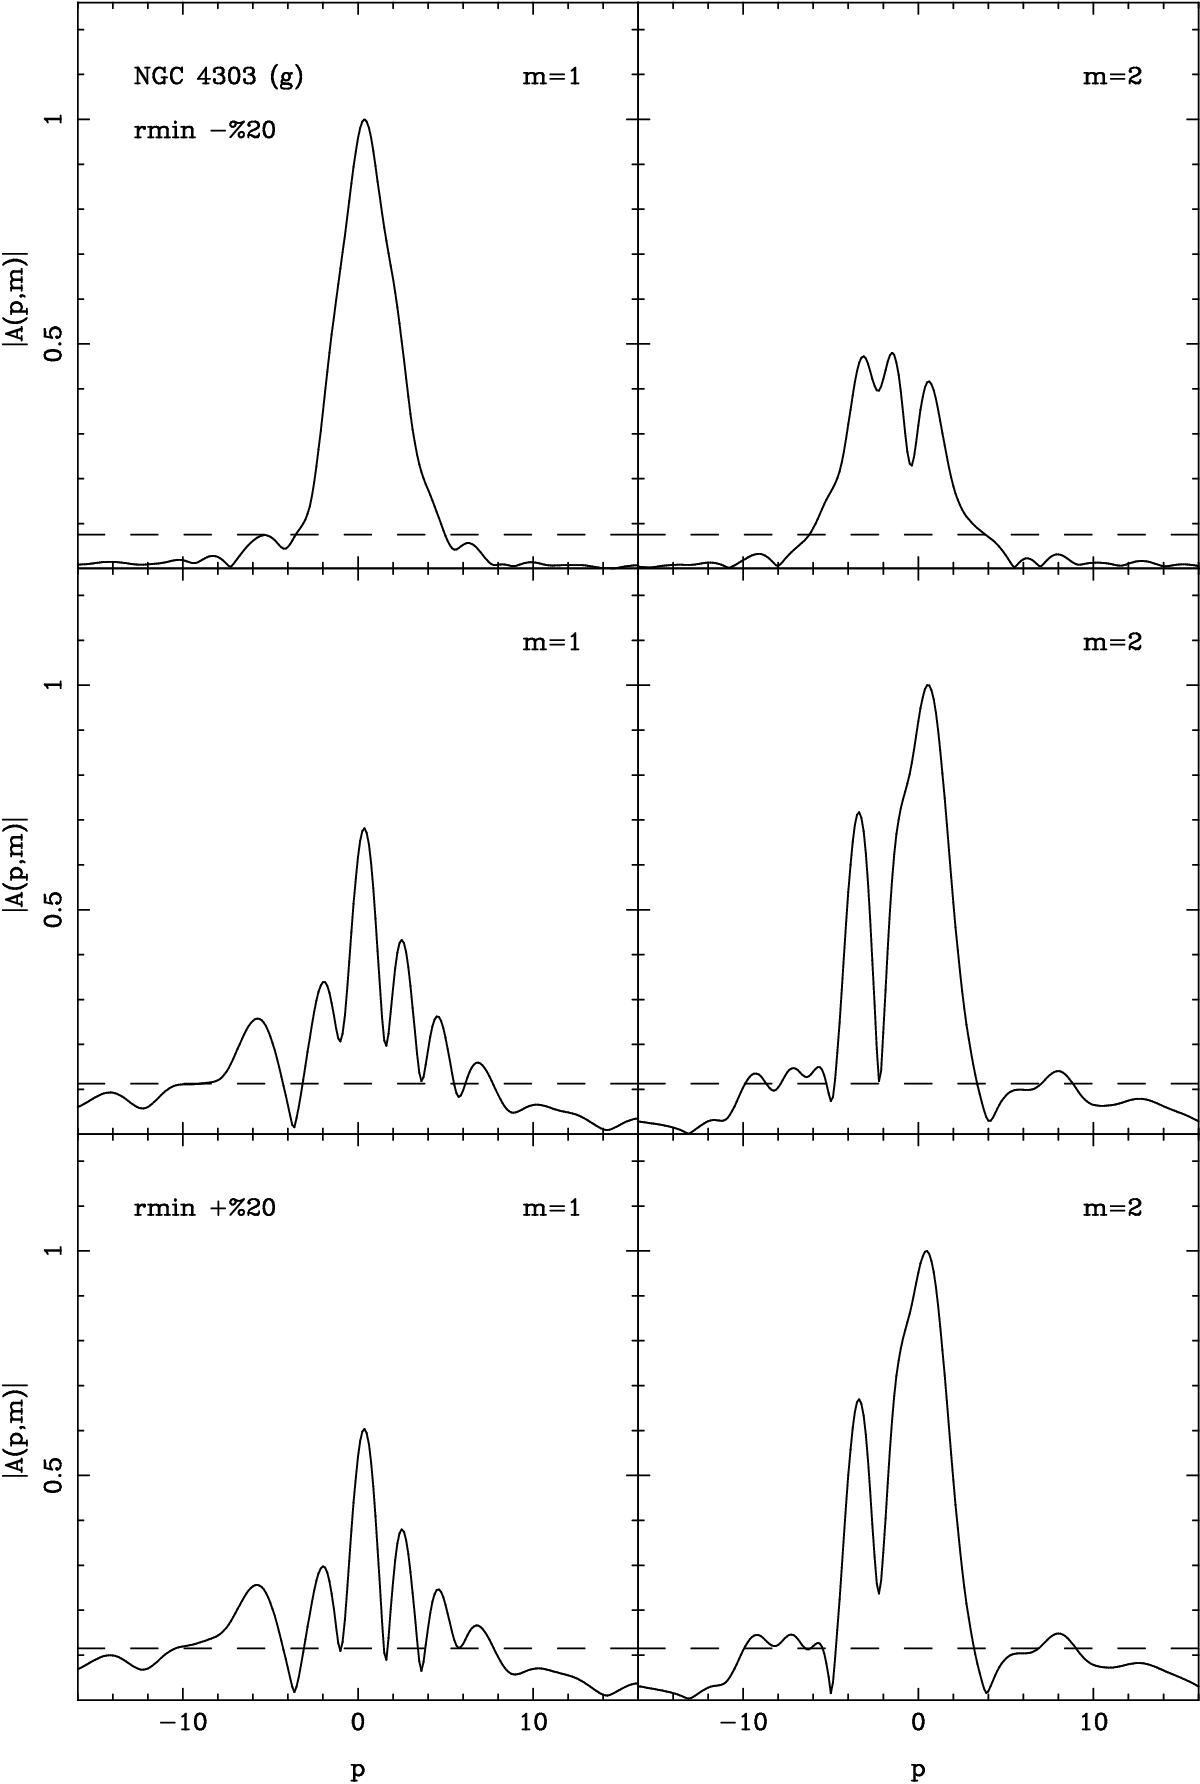
Upper panel: modulus of the m = 1 and m = 2 Fourier spectra obtained from a g band image of the galaxy NGC 4303 using a rmin value lower by a 20%. Middle panel: same spectra obtained the right value of rmin. Lower panel: spectra obtained using a value of rmin20% higher.
Current usage metrics show cumulative count of Article Views (full-text article views including HTML views, PDF and ePub downloads, according to the available data) and Abstracts Views on Vision4Press platform.
Data correspond to usage on the plateform after 2015. The current usage metrics is available 48-96 hours after online publication and is updated daily on week days.
Initial download of the metrics may take a while.