Fig. 9
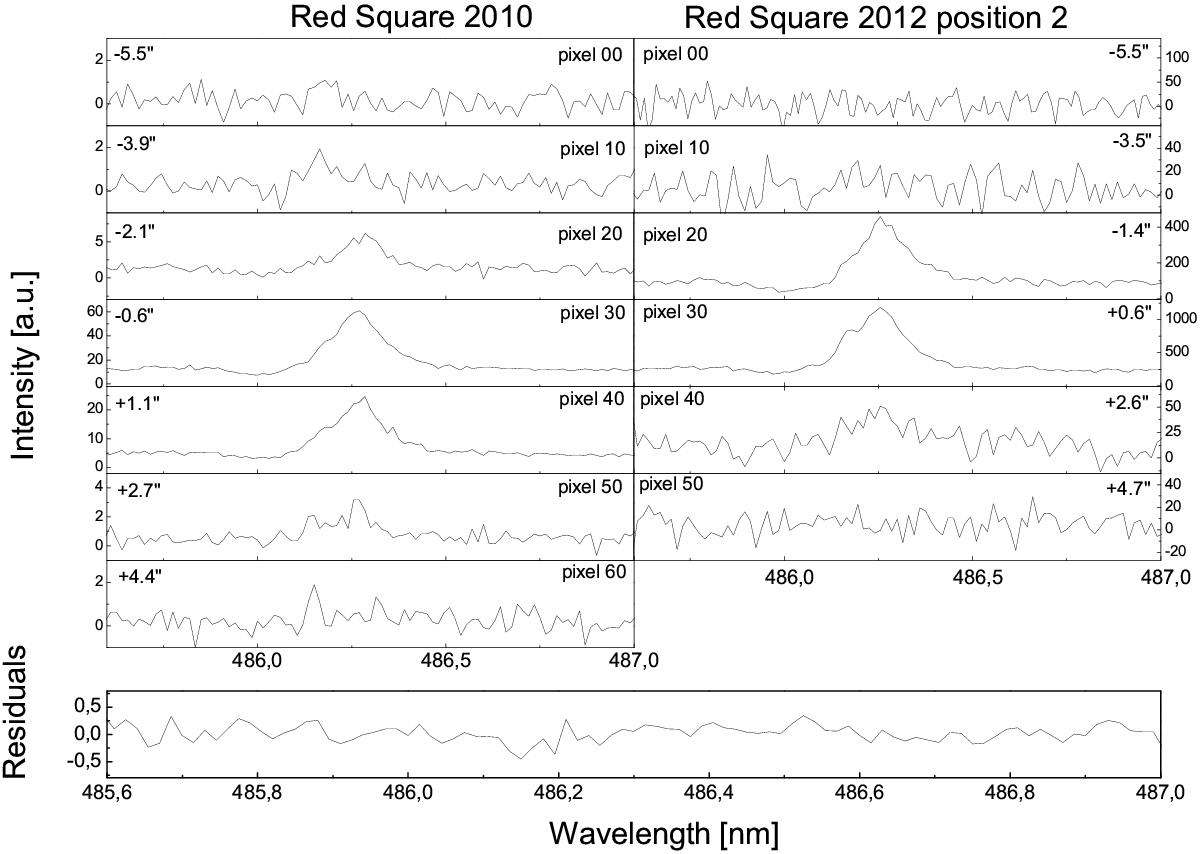
Zoom-in on the Hβ line is shown for the spectrum taken in 2010 and for the spectrum taken in 2012, position 2. Both spectra show clearly the P Cygni line profile of the Hβ line. Again, there is no difference in the individual line profiles for the different pixel spectra, and/or slit positions. The bottom-most panel gives the residuals of the slit spectrum in 2012 (position 2) when the spectrum at +0.6′′ (pixel 30) is subtracted from the spectrum at −2.5′′ (pixel 15) distance to the central star. Negative distances indicate directions in the south-(east) of the nebula. Positive distances indicate directions towards the north-(west).
Current usage metrics show cumulative count of Article Views (full-text article views including HTML views, PDF and ePub downloads, according to the available data) and Abstracts Views on Vision4Press platform.
Data correspond to usage on the plateform after 2015. The current usage metrics is available 48-96 hours after online publication and is updated daily on week days.
Initial download of the metrics may take a while.